

Key takeaways
- Accurate grid modelling protects engineering projects from costly surprises by aligning simulation behaviour with what hardware will show later in the lab.
- Clear distribution feeder modelling, with realistic topology and device representation, helps planning, protection, and operations teams share a common view of the same network.
- Consistent practices around validated component data, per unit systems, and steady state configuration strengthen confidence in study results across many scenarios and projects.
- Representing protection, control logic, and solver settings with the right level of detail turns grid models into practical tools for coordination studies, teaching, and research.
- SPS SOFTWARE supports these modelling habits with transparent, physics based components that fit naturally into MATLAB and Simulink workflows and scale from classroom models to complex grids.
Accurate grid models quietly protect your time, your budget, and your engineering reputation. Small mismatches between what the model predicts and what the hardware later shows can trigger long nights of debugging. Voltage levels that look comfortable in simulation can suddenly sag, trip protection, or upset converters once a project reaches the lab. Careful attention to how you build, validate, and use grid models keeps those surprises rare and makes every study more useful.
Power system engineers, protection specialists, researchers, and students all rely on simulation to understand how networks behave before equipment moves anywhere near a test bench. Simple errors in grid modelling, such as incorrect base values or missing control settings, can silently distort results and hide issues that later appear in the field. Clear modelling practice turns each study into a reusable asset that supports future projects, training, and research. Stronger habits around data, structure, and study setup give you more confidence in every waveform and report that your models produce.
Why accurate grid modelling supports better engineering outcome
Accurate grid modelling acts as a bridge between theory, laboratory testing, and field performance. When component parameters, line impedances, and control settings reflect reality closely, the simulated response to faults, switching events, and load changes looks much closer to what users will later observe on hardware. That alignment means you can size equipment with more confidence, tune controllers more efficiently, and justify design choices with clear evidence. Projects then move through design reviews, procurement, and commissioning with fewer surprises because the studies already anticipate most important behaviours.
Precise models also support communication across engineering teams and with stakeholders who review study results. When a single, trusted model underpins protection coordination, stability assessments, and power quality checks, discussions shift from arguing about assumptions to deciding which mitigations make sense. Students and researchers benefit as well, because accurate parameter sets and transparent equations make it easier to relate classroom theory to what they see in simulation plots. Over time a well maintained model library becomes a shared reference that shortens future studies and helps new staff come up to speed faster.
How distribution feeder modelling improves study clarity

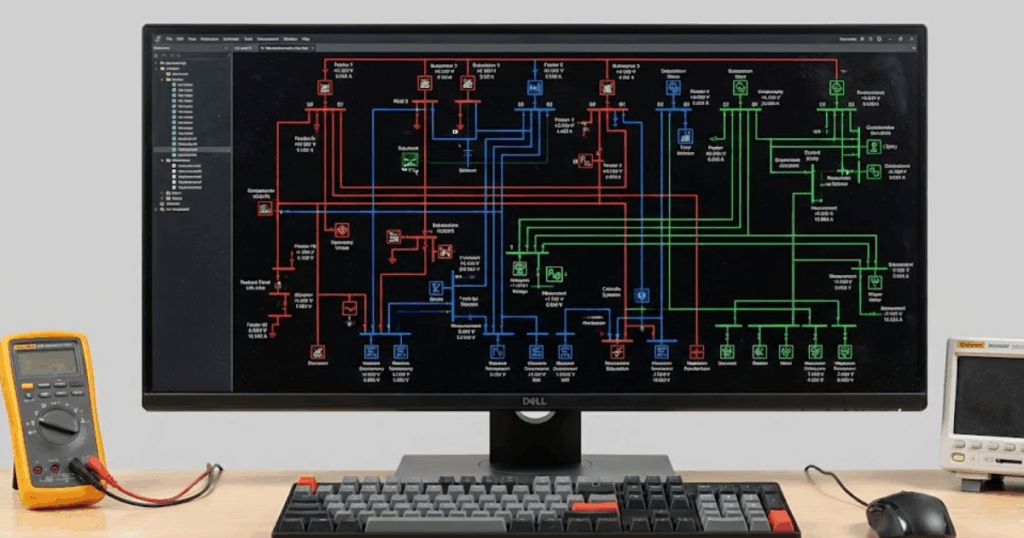
Distribution feeder modelling brings much needed structure to the part of the grid that sits closest to customers, equipment, and local generation. Accurate representation of feeder sections, phase connections, laterals, and grounding lets you see how voltage drops, unbalance, and fault currents spread across the network. Instead of treating the feeder as a single lumped impedance, you can study how individual devices such as voltage regulators, capacitor banks, and reclosers shape the response at different points. That extra clarity is essential when you compare options for connecting new loads or distributed energy resources, or when you investigate why protection devices operate unexpectedly.
Careful distribution feeder modelling also improves coordination between planning studies and protection studies. When planners, protection engineers, and operations staff all work from the same feeder model, each team can apply its own scenarios while trusting that the underlying electrical data remains consistent. Engineers then gain a clearer sense of where measurement points, new automation devices, or upgraded conductors will provide the most benefit for reliability and power quality. For teaching and research, a detailed feeder model offers a concrete setting where students can explore the impact of faults, switching, and new control schemes without touching physical equipment.
7 techniques to build accurate grid models
“Accurate grid models quietly protect your time, your budget, and your engineering reputation.”
Accurate grid models start with good data, clear structure, and deliberate choices about study scope. Engineers who treat modelling as a repeatable process instead of a one off task usually see fewer surprises and more reliable conclusions. Each simulation step, from component parameter entry to solver selection, either preserves physical realism or slowly pulls results away from what hardware will show later. Consistent attention to practical techniques for model validation, structure, and study setup helps you connect everyday modelling work to more useful insights, safer testing, and stronger designs.
1. Validate every component model with trusted electrical parameters
Component models form the foundation of any grid study, so each one needs parameters that reflect actual equipment behaviour. Start with manufacturer data sheets, nameplate ratings, and test reports, then cross check values such as impedances, time constants, and saturation levels against typical ranges. When values look unusual, a quick comparison with field measurements or past projects can reveal typing mistakes, incorrect units, or misapplied base quantities before they affect results. Loads, cables, transformers, machines, and converters all benefit from this simple validation loop, and small corrections at this stage often prevent misleading voltage or current waveforms later.
Good practice also includes documenting where each parameter set came from, so others can trace assumptions and decide when updates are necessary. Short notes that reference test dates, lab reports, or manufacturer versions give context that survives beyond the original modeller. Many teams maintain a central library of vetted component models, which reduces repetition and keeps study inputs aligned across projects. Students and new engineers gain confidence faster when they know the components in their diagrams reflect trusted electrical parameters instead of guesses.
2. Use feeder topology data to create a clear distribution structure
Accurate feeder topology turns a collection of buses and lines into a representation that matches how poles, cables, and switches exist in the field. Engineers often have access to geographic information system records, planning diagrams, or protection one line drawings that describe how sections of the feeder connect. Translating that information into clearly named buses, switches, and line segments reduces confusion during model reviews and simplifies future changes. Consistent naming, phase labelling, and section grouping make it much easier to discuss specific locations with colleagues and to match study results with equipment in the yard.
Distribution feeder modelling benefits greatly from including normally open points, alternate feeds, and major tie switches so that alternative configurations sit only a few clicks away inside the model. With that structure in place, planners can examine how load transfers impact voltage, losses, and fault levels, while protection engineers can test device settings under multiple switching conditions. Researchers and students can then apply automation schemes or distributed energy resource controls on top of a feeder that feels familiar to practising utility staff. This level of structural clarity turns the feeder model into a shared reference for planning, protection, and academic work instead of a private experiment on one engineer’s machine.
3. Build network representation using consistent per-unit systems
A consistent per unit system keeps network representation clean, scalable, and easier to debug. Selecting base power and voltage values carefully at the start of a project prevents confusion when models span multiple voltage levels, transformers, and study cases. Once bases are set, every component should use the same convention, with clear documentation of nominal ratings, connection types, and phase counts. Mixing nameplate values and per unit values without discipline almost guarantees mistakes in impedance, short circuit capacity, or thermal loading calculations.
Teams that work across several tools or subsystems often define a shared per unit policy so that models exchange data cleanly. That policy might specify base quantities for transmission, sub transmission, and distribution levels, along with examples that show how to convert vendor data into internal formats. Once engineers become comfortable reading and comparing values in per unit, spotting unrealistic line impedances or transformer reactances becomes much easier. Clear per unit practice also helps students bridge the gap between textbook exercises and larger system studies, since they can reuse familiar techniques at greater scale.
4. Apply a steady state configuration before running dynamic cases
Many simulation problems vanish when a model starts from a coherent steady state configuration instead of arbitrary initial conditions. Running a power flow and saving the resulting voltages, currents, and device operating points as initial states gives dynamic studies a realistic starting point. Machines start with correct rotor angles, controls begin near their normal operating values, and tap changers or regulators sit at plausible positions. This preparation reduces artificial transients that might otherwise obscure the true impact of a fault, switching event, or control change.
Without an agreed starting point, two engineers can build models that look similar yet respond differently because each one makes different assumptions about initial load or generation levels. Documented steady state configuration files or templates make that starting point explicit and repeatable across projects, courses, and research studies. Students who learn to set up these conditions early develop a habit of treating power flow, initial states, and dynamic runs as parts of one consistent workflow. Complex projects also benefit when offline simulations line up with hardware tests, because the hardware needs realistic initial voltages and currents from the moment trials begin.
5. Represent protection and control logic with transparent settings
Protection and control logic often decides how a grid responds to faults, switching, and abnormal conditions, so clear representation matters. Instead of modelling relays, reclosers, and controllers as abstract blocks, use settings that match field devices, including pickup levels, delays, and reclosing sequences. Aligning simulated logic with actual schemes lets protection staff verify grading curves, coordination margins, and zone coverage inside the same tool others use for power flow and dynamics. Transparent settings also make it easier for reviewers to trace why a device operated in simulation and to suggest adjustments without guessing at hidden parameters.
Educators can use these models to teach students how time current curves, inverse functions, and logic diagrams translate into actions on currents and voltages. Researchers gain a safe space to test new control algorithms while still grounding them in realistic device limits and communication delays. For utilities and large industrial plants, sharing protection and control models with equipment manufacturers can speed up joint studies and reduce misunderstandings. Over time, a library of transparent protection and control schemes becomes a valuable asset that supports audits, post event analysis, and training.
6. Match switching, sampling, and solver settings to the study needs
Switching behaviour, sampling rates, and numerical solver choices strongly influence how well a model captures fast electrical phenomena. High frequency switching events require smaller time steps, detailed device models, and sampling aligned with gate signals, while slower stability studies can tolerate larger steps and averaged models. Choosing a solver without considering these needs can either miss important waveforms or waste computational effort where it adds little insight. Careful alignment among switching patterns, controller sample times, and solver step sizes keeps numerical noise low and preserves the physics you care about.
Many teams define standard solver settings for classes of studies, such as power quality analysis, stability checks, or harmonic assessments, then refine them as experience grows. Documenting these defaults inside project templates saves time for students and engineers who build new cases, and it encourages consistent treatment across different projects. Where hardware in the lab will eventually connect to the model, aligning sample times with measurement and control hardware helps reduce integration issues later. Clear guidance on solver configuration turns what can feel like guesswork into a repeatable technical choice grounded in study objectives.
7. Use measurement points to verify responses at key locations
Measurement points convert a model from a static diagram into a source of insight that engineers can interpret quickly. Strategic placement of voltage, current, and power measurements at sources, key buses, and sensitive loads shows how events propagate through the system. Waveform viewers, phasor plots, and numerical logs all benefit from a consistent naming convention so that plots, screenshots, and reports tell a clear story. Without well placed measurements it becomes difficult to explain study outcomes, compare cases, or trace the origin of unexpected results.
Measurement points also support systematic validation, since you can compare simulated quantities at specific locations with field data or reference models. Once those comparisons look reasonable, engineers gain confidence that the model responds correctly to new scenarios such as different fault locations, loading patterns, or protection settings. Students can build intuition by observing how the same disturbance looks from different points in the system, reinforcing concepts like impedance, distance, and fault level. Over time, a standard set of measurement locations across projects simplifies study review, supports regression testing, and improves communication between teams.
Accurate grid models rarely come from a single clever trick and instead grow from disciplined habits that engineers apply every day. Careful parameter validation, clear topology, consistent per unit practice, and realistic starting conditions all work as a set to keep simulations close to physical behaviour. Thoughtful protection, solver, and measurement choices then turn raw simulations into studies that answer concrete engineering questions with confidence. When these techniques become standard practice across teams, grid modelling shifts from a source of uncertainty into a reliable way to support design, teaching, and research decisions.
“Accurate grid models rarely come from a single clever trick and instead grow from disciplined habits that engineers apply every day.”
How SPS Software supports more precise and more confident grid modelling

SPS SOFTWARE gives power engineers, researchers, and educators a modelling workspace that feels familiar yet is purpose built for electrical systems. You can represent grids, converters, feeders, and protection logic with physics based component models that stay transparent, so colleagues and students always see how equations and parameters link back to real equipment. The platform aligns offline electromagnetic transient studies, phasor based analyses, and teaching examples inside the same tool, which makes it easier to reuse models across courses, feasibility studies, and early product design work. For many users this fits directly into existing model based design workflows, so you can keep using familiar signal processing, control design, and scripting tools while focusing on system behaviour instead of file conversions.
OPAL-RT builds SPS SOFTWARE on experience with offline simulation, real time testing, and Hardware-in-the-loop (HIL), so the same models can support both exploratory studies and rigorous validation. The commercial strategy around the platform focuses on education, research, and industrial teams that need transparent, physics based models rather than black box components, which aligns well with grid and power electronics studies. Website plans and product resources emphasise clear documentation, example models, integration guides, and onboarding material, so new users can reach meaningful studies without spending weeks learning basic workflows. All of these choices position SPS SOFTWARE as a reliable, credible, and authoritative companion for precise grid modelling over the long term.