

Key Takeaways
- Harmonic resonance is a network impedance problem, so device level harmonic limits never tell you enough on their own.
- Frequency scans find where the grid is sensitive, and time domain checks show which switching or control events will excite that sensitivity.
- Careful model detail at weak buses will do more for study quality than broad assumptions across the full network.
Harmonic resonance studies will show you where a grid will magnify distortion before a routine equipment addition turns a small harmonic source into a serious voltage problem.
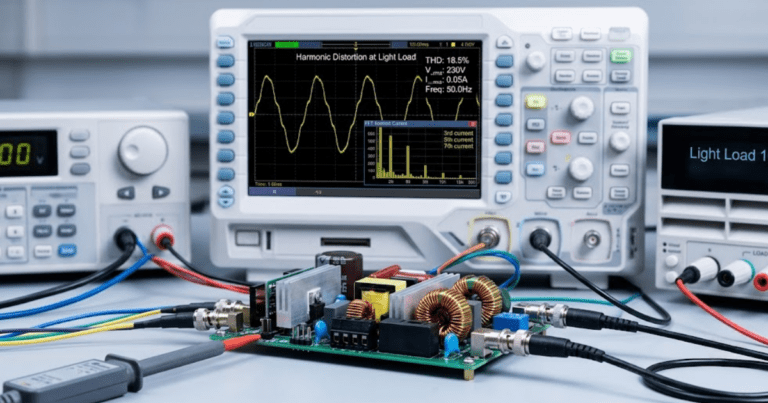
Utilities and plant engineers keep adding converter-based generation, drives, and reactive support because the grid needs stable voltage and efficient power flow. Resonance risk rises with that mix, since each filter, cable, transformer, and capacitor shifts the network impedance seen by harmonic currents. Renewable capacity additions reached almost 560 GW in 2023, up 64% from 2022, which shows how quickly inverter-based equipment is being added to power systems. A study plan that combines frequency scans with time domain checks will show you the resonant points before equipment insulation, protection, or control performance is affected.
Harmonic resonance occurs when network impedance peaks sharply
Harmonic resonance happens when inductive and capacitive elements line up at a frequency where network impedance rises sharply, so a small harmonic current creates a much larger voltage distortion. You’ll see the problem as amplification of specific frequencies, and that distinction matters when you assess risk.
A 13.8 kV feeder with a capacitor bank, transformer leakage reactance, and several long cables can resonate near the 5th or 7th harmonic. A modest current from a variable speed drive or solar inverter will then produce bus voltage distortion that looks out of proportion to the source. Operators often blame the nearest device alone, even though the grid impedance is doing most of the amplification. Your study has to focus on the full network shape and the emitter that excites it.
That focus will keep you from chasing the wrong fix. Swapping one inverter controller or tightening a distortion limit will not solve a resonance tied to feeder capacitance and source strength. You need the resonant frequency, the impedance peak, and the bus location where the response is worst. Once those are known, mitigation becomes an engineering exercise instead of trial and error.
Inverters shift resonant points through controls filter design
Inverters shift resonant points because their filters, transformer connections, cable lengths, and control loops alter the frequency-dependent impedance of the grid. A bus that looked benign before a plant expansion will resonate after the added equipment changes that impedance map, even if each inverter still meets its individual harmonic limits.
Solar, storage, and wind made up 95% of the 2,600 GW waiting in United States interconnection queues at the end of 2023. That scale matters because queued projects add more converters, more collector cables, and more reactive equipment to the same network. A 100 MW plant expansion often adds enough filter capacitance to shift an existing resonance from one harmonic order to another. Your study should treat every large inverter addition as a network change, not a simple replacement.
Controls add another layer. A grid-following inverter with an LCL filter will interact differently from a plant using different damping values or a different phase-locked loop bandwidth. Two sites built from similar single line diagrams can produce very different scan results once those parameters are included. That’s why simplified generic inverter blocks often miss the frequencies that later show up during commissioning.
Capacitor banks can amplify distortion at specific frequencies
Capacitor banks amplify distortion when their reactance combines with system inductance at a frequency near existing harmonic content. The bank itself does not create the harmonic source, yet it can set the condition that turns a tolerable current injection into damaging bus voltage, relay nuisance operation, or repeated capacitor stress.
A 34.5 kV station with switched capacitor banks can behave very differently before and after a bank closes. The bus voltage may stay within limits at fundamental frequency while the 7th harmonic rises sharply after the switching step. Engineers sometimes see the distortion event and assume a control fault in the nearest inverter. The stronger explanation is often a shifted parallel resonance created by the bank.
This is why capacitor studies need more than kvar sizing. Detuning reactors, bank location, and switching sequence will all affect where the peak lands. Industrial plants with power factor correction face the same issue as renewable collector systems, especially when background harmonics already exist upstream. You’ll get better results when capacitor planning and harmonic studies happen as one task rather than separate reviews.
Frequency scans show where small sources create large voltages
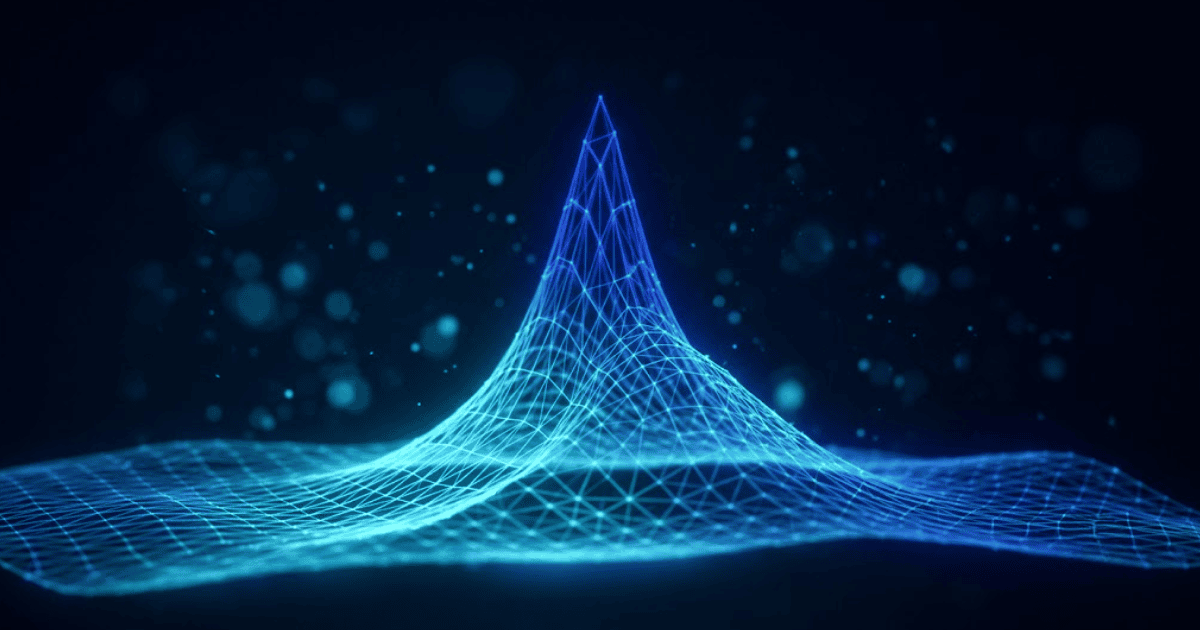
“A frequency scan maps system impedance against frequency, and the peaks tell you where a modest harmonic current will create a large voltage response.”
It is the fastest way to find resonance risk before commissioning, because it shows both the resonant frequency and the bus where the network is most sensitive.
A plant interconnection study often scans from the point of common coupling down to inverter terminals and auxiliary buses. One bus may show a mild response at the 5th harmonic while a collector bus shows a steep peak near the 11th. That contrast tells you where to place filters, where to shift capacitor settings, or where more model detail is needed. A scan will also show when a new cable run moves the peak enough to matter.
| Scan pattern | Practical reading |
| A tall narrow peak appears near the 5th or 7th harmonic. | A small current at that frequency will create a large voltage rise. |
| A peak appears only when a capacitor bank is closed. | The switching state is setting the resonant point and needs its own case. |
| Several nearby peaks show up across higher harmonics. | Cable capacitance, filters, or converter detail are shaping the response. |
| The utility bus looks calm while an internal bus spikes. | Local resonance exists inside the plant and external measurements will miss it. |
| A peak shifts after a new feeder or inverter block is added. | The network change has altered impedance enough to revisit mitigation. |
Time domain studies confirm resonance under switching events
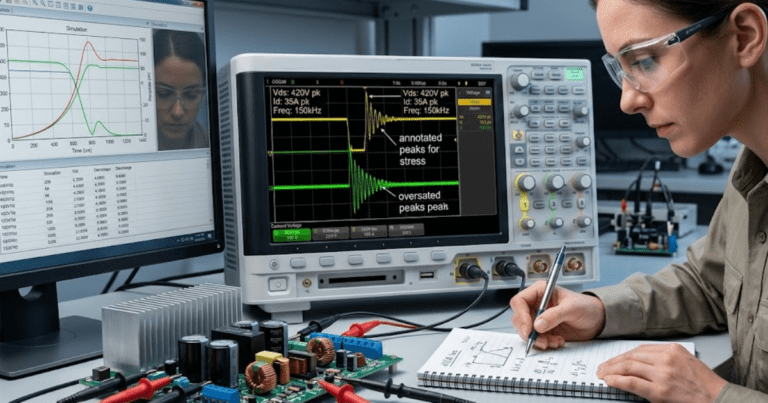
Time domain studies test resonance under switching and control events that a scan cannot show on its own. They will confirm if a resonant point actually produces harmful overvoltages, sustained ringing, or current stress when a capacitor closes, an inverter ramps, or a fault is cleared.
A capacitor energization event at a weak bus can excite a resonant frequency for several cycles, even when steady-state harmonic injection looks small. An inverter trip and reclose sequence can do the same if DC link controls and plant-level reactive control re-enter with the wrong timing. SPS SOFTWARE is useful here because you can pair a frequency scan with a transparent time domain model and test the same network under switching events. That link between scan results and waveform response is what turns suspicion into proof.
This step matters because not every scan peak becomes an operating problem. Some peaks sit near frequencies with no meaningful source, while others line up with switching patterns, converter sidebands, or background distortion already present on the feeder. You’ll make better mitigation choices when you know the event that excites the resonance, the duration of the response, and the devices that see the highest stress. That evidence also helps protection and operations teams agree on settings and switching rules.
Model detail determines which resonant peaks appear
Model detail decides which resonant peaks you will find, because resonance is set by the actual inductance, capacitance, resistance, and controls present in the network. A study that lumps cables, omits transformer winding data, or treats filters as generic blocks will shift or erase peaks that exist on the site.
A collector system with several 2 km cable segments behaves differently from the same plant modelled as one equivalent line. Each segment adds distributed capacitance and modifies the local impedance seen from nearby buses. Transformer grounding, winding connection, and stray capacitance also affect zero-sequence and high-frequency response. Those details are tedious, but the missing data will usually hurt the study more than an imperfect load estimate.
You don’t need infinite complexity. You need enough fidelity at the frequencies of concern and at the buses where distortion will be measured or equipment will trip. Good harmonic analysis software is most useful when the model is transparent about assumptions, so engineers can edit parameters, rerun cases, and understand why a peak moves after a design change. That approach is more useful than a closed black box that gives a plot without revealing the network physics.
Study the weakest buses before adding new devices
The weakest buses deserve attention first because they combine low short circuit strength with equipment that shifts impedance. These are the buses where added inverters, capacitor banks, or long cable runs will produce the biggest resonance swings, and where mitigation choices will have the largest effect on the whole system.
A study plan works best when you rank buses before you model every corner of the grid. A point of common coupling may look like the obvious first target, yet the more sensitive location is often a collector bus, an auxiliary medium voltage bus, or a capacitor bank terminal. One industrial feeder can stay quiet at the utility interface while a motor control bus sees severe local amplification. These are the places most teams should check first:
- The collector bus that ties many inverter blocks through long cables deserves an early scan.
- The bus where a switched capacitor bank or filter connects needs separate operating cases.
- The weakest feeder seen by the lowest short circuit ratio should be ranked near the top.
- The low voltage side of a transformer feeding dense power electronics often hides local peaks.
- The remote end of a long cable run with light local load can show sharp impedance swings.
This ranking will save time and improve the first pass of your model. It also keeps you from spending days refining buses that cannot excite or magnify the frequencies you care about. Once the high-risk buses are understood, you can expand the scan set and test contingencies with much better focus. Your mitigation plan will then reflect the actual weak points instead of the simplest single line location.
Common modelling errors hide resonance until equipment trips
Common modelling errors hide resonance because they flatten the impedance curve or place peaks at the wrong frequency. The usual culprits are equivalent cables, missing capacitor states, generic inverter filters, stale utility source data, and cases that stop at a scan without checking the operating event that excites the peak.
One site can pass a preliminary study and still trip capacitor protection after energization because the model used nominal source strength and ignored an alternate feeder configuration. Another site can appear unsafe on paper until the engineer adds the damping resistor that was present in the actual filter bank.
“Good harmonic work is less about software features and more about model discipline, because missing one cable section or mistuning one filter can erase the very peak that later trips equipment.”
You’re judging a physical system, so the model has to stay close to the physical system.
That is the standard you should hold for every harmonic resonance study. A solid workflow pairs frequency scans with time domain checks, updates the model after each design revision, and tests the buses most likely to amplify distortion. SPS SOFTWARE fits that workflow because it supports transparent modelling and lets engineers verify resonance risk before equipment is exposed to avoidable stress. Careful execution will always beat guesswork when resonant points move each time a grid adds new inverters or capacitor banks.