

Contact us
Contact us
Simulation
Modelling, Simulation, Student

How Students Assess and Evaluate Model Quality

Key Takeaways

  • Model quality stays high when purpose, evidence, and repeatability stay aligned.
  • An evaluation scorecard turns review criteria into consistent scoring and clearer feedback.
  • Shared criteria between students and educators will make grading fairer and habits stronger.

You will judge model quality faster and more fairly when you score it against clear criteria, not a gut feel. Formative feedback cycles show measurable gains; one synthesis reported a mean effect size of 0.32. The same pattern shows up in engineering labs, since repeated checks beat one big grade. Consistent evaluation will turn modelling from guesswork into a habit you can defend.

Model quality is not about packing the most blocks into a diagram. Quality means your model will answer the question it claims to answer, with results you can explain and repeat. Students improve faster when evaluation looks like a small test plan with logged evidence. Educators grade with less noise when the same evidence is visible to everyone.

What students mean when they evaluate model quality

Students evaluate model quality when deciding whether a model is fit for its stated purpose. The check includes correctness, clarity, and repeatability, not just a clean plot. A model is high-quality when another person can run it and get the same result. A model is considered low-quality when its results depend on hidden tweaks or missing context.

A microgrid lab model exposes this fast. One student tunes a voltage sag response until the waveform looks right, then forgets to state the source impedance used. A lab partner runs the same file and sees a different sag depth, but cannot reconcile the mismatch. Quality drops because the model’s story is not repeatable.

Good evaluation starts with a plain question: what will this model support, and what will it not support. “Runs without errors” is a low bar for engineering work. A model that runs can still violate units, sign conventions, or energy balance. Evaluation shifts the focus from “did it run” to “did it prove anything.”

The core criteria students use to judge model quality

Most student reviews map to a small set of review criteria that work across courses. Accuracy matters, but it must tie to a reference you can defend. Consistency checks matter because they catch mistakes without extra data. Transparency matters because a hidden assumption will break peer review and grading.

An RLC step response assignment makes the criteria concrete. A strong model matches the expected damping ratio, maintains unit consistency, and shows the source of initial conditions. A weak model matches the plot only after random parameter edits, then hides those edits inside subsystems. The same criteria still apply to feeders, converters, and protection logic models.

We trust a model when we can trace each result back to evidence. Accuracy without traceability will not earn trust, since no one can see why the match occurred. Traceability without accuracy also fails, since the model will not answer the task. Quality stays strong when you balance criteria and match the grader’s focus.

“Evaluation shifts the focus from “did it run” to “did it prove anything.”

How students build an evaluation scorecard that stays consistent

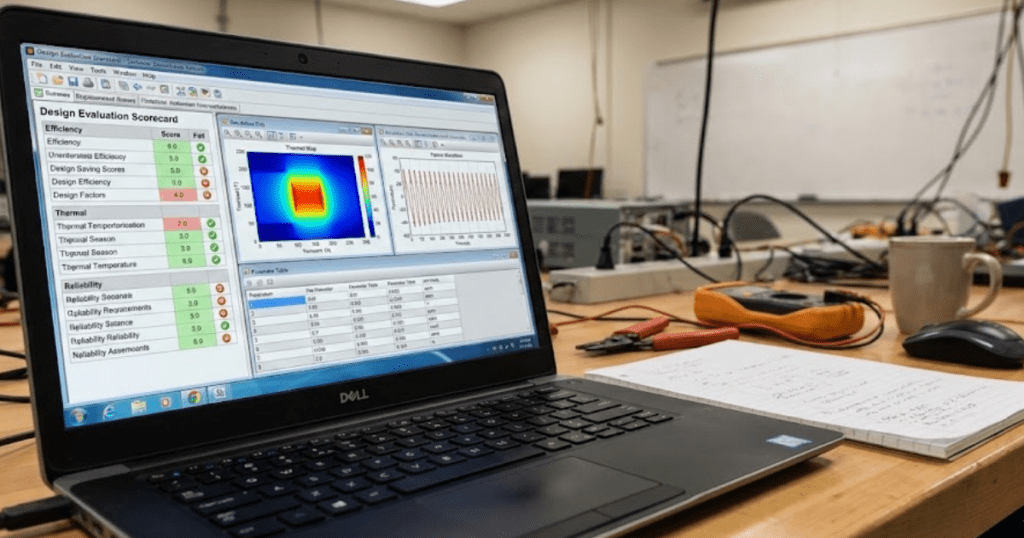
An evaluation scorecard turns model review into repeatable scoring. You define criteria, tie each to evidence, and score the same way each time. Consistency beats clever weighting, since graders trust repeatable checks. Self checks speed up when evidence is clear.

Disagreement drops when the scorecard requires evidence. One published study reported an overall inter rater reliability ICC of 0.7 when evaluators scored the same work with a shared rubric. Students can mirror this by anchoring each score level to an artifact, not a feeling.

Aspect being checkedWhat strong model quality looks likeWhat weak model quality looks like
Purpose alignmentThe model answers a clearly stated question and stays focused on that task from start to finish.The model includes extra behavior that does not support the stated task or distracts from it.
Assumptions visibilityAll simplifying assumptions are written down and their impact on results is explained.Assumptions are implied or hidden, making results hard to interpret or trust.
Evidence for correctnessResults are supported by reference checks, sanity tests, or expected physical behavior.Results rely only on visual agreement or tuning without justification.
Repeatability of resultsAnother person can run the model and reproduce the same outputs using the same inputs.Results change when someone else runs the model or when files are reopened.
Transparency of parametersKey parameters, units, and initial conditions are easy to locate and understand.Important values are buried in subsystems or lack units and context.
Review readinessThe model includes notes or artifacts that support grading and peer review.The model requires verbal explanation because supporting evidence is missing.

Transparent models make scorecards easier to apply, since you can point to equations and parameters. SPS SOFTWARE supports this style when labs need inspectable models for review. Clarity cuts debate and regrading. Feedback gets sharper because each gap maps to one row.

The sequence students follow when reviewing a technical model

A good review order saves time because early checks catch the biggest errors. Start with purpose and scope, then check the structure and run simple sanity tests, then judge the results. The order stops you from tuning a broken model. Notes become easier to follow for peers and educators.

  • Confirm the purpose, inputs, and expected outputs
  • Check topology and signs against the reference schematic
  • Run sanity checks on units, limits, and initial states
  • Compare key results to an analytic check or baseline run
  • Record tests run and evidence collected

A lab partner reviewing a converter model can apply these steps in minutes. The reviewer confirms the switching frequency and control targets, then checks the power-stage wiring. A no load run should keep current near zero and voltages in range. Only then should the reviewer judge efficiency or waveform shape.

Later tests assume earlier checks are correct. Controller tuning before sensor scaling checks will waste hours and still result in a failing grade. The sequence reduces bias in peer assessment, since everyone follows the same path. Educators grade faster when the student assessment steps align with the grader’s workflow.

How assumptions and scope shape student quality assessments

Assumptions and scope define what “correct” will mean for your model. A model can be excellent inside its scope and useless outside it. Students who write scope clearly avoid unfair criticism, since reviewers know what was intentionally left out. Educators reward clear scope because it shows engineering judgment.

A power electronics task that targets control-loop stability illustrates the trade-off. An averaged converter model will cleanly answer the stability question, while a switching model will bury it under ripple and step-size noise. The averaging assumption is valid when you state frequency separation and explain why ripple is not the metric. Quality rises because the model matches the task.

Scope also changes what tests you should run. An EMT level network study will need checks on time step, solver limits, and numerical stability, while a steady state RMS study will need checks on balance and phasor assumptions. Students lose points when they test the wrong thing, then claim the model is “validated.” Clear scope keeps tests aligned with what the model claims to represent.

Common errors students make when scoring model quality

Students often score models based on output shape rather than evidence. That habit rewards tuned models and punishes models that document their work. Another error is mixing critique of the idea with critique of the implementation. Quality scoring should focus on what the model proves, not what you wish it proved.

A classic failure occurs when a single nominal waveform match ends the review. The model passes the nominal case but fails under a small change, such as a load step or a shift in fault impedance. Another failure shows up when time steps are chosen for speed, which distorts dynamics and hides instabilities. Review criteria that include repeatability and sensitivity checks will catch both issues.

Self assessment also fails when documentation gets skipped because the model is “obvious.” Missing units, initial states, or parameter sources will block grading and peer review. Students also lose points when a value changes without a note, so the final model has no audit trail. A scorecard forces discipline, since each row needs a specific artifact.

“The closing judgment is simple: disciplined evaluation is part of engineering, not extra paperwork.”

How educators align feedback with student assessment criteria

Educators grade student models best when feedback points to the same evidence students used for scoring. Clear criteria reduce arguments about style and focus attention on what the model will support. Alignment also means educators will show what “good” looks like in the same format used for grading. Students learn faster when feedback turns into the next test you should run.

Calibration before grading keeps scores consistent across sections. Two graders score the same sample model, compare notes, and adjust scorecard wording until scores match. Students can mirror this during peer review by swapping models and scoring them independently, then discussing one mismatch at a time. The result is fairer grading and stronger habits.

The closing judgment is simple: disciplined evaluation is part of engineering, not extra paperwork. Students who treat review criteria as a test plan will build models that teach as they run. Educators who align comments with the scorecard will spend less time defending grades and more time coaching. SPS SOFTWARE supports this approach when labs want transparent, inspectable models that make evidence easy to show.

Electrical Engineering, Modelling, Simulation

5 Steps To Build Inverter Control Models

Key Takeaways

  • Timing, limits, and signal definitions will decide if tuning results carry to hardware.
  • PWM modelling depth should match loop bandwidth, with delays treated as first-class dynamics.
  • Inner and outer loop separation plus worst-case stability checks will prevent late-stage surprises.

A good inverter control model will predict stability before hardware runs. You will tune faster because control stability margins stay visible. You will catch phase loss and windup early. That matters more than matching switching ripple.

Most problems start when the model is too ideal. PWM modelling that ignores update delay will overstate phase margin. Inner loop control that skips sensor filtering will overstate bandwidth. Outer loop control that assumes a fixed grid or load will break as conditions shift.

What engineers need from an inverter control model before tuning begins

Lock down what the controller sees and when it sees it before you touch a gain. Put sample time, carrier rate, delay, and measurement filtering into the model. Define every signal with units, scaling, and sign. Add limits and saturations that will exist in hardware.

A three-phase inverter switching at 10 kHz with a 50 µs step is a good test bed. Duty updates once per step, so model a one-step delay from compute to PWM output. Add the same 2 kHz current filter and sensor scaling you plan to ship. Sweep DC link from 700 V to 900 V and vary grid inductance from 0.5 mH to 2 mH.

Timing and limits decide where crossover can sit without ringing. Hidden delay steals phase and turns a safe gain into oscillation. Missing saturation hides integrator windup and makes transients look gentle. A lean model with visible assumptions will beat a detailed model with hidden ones.

“Hidden delay steals phase and turns a safe gain into oscillation.”

5 steps to build inverter control models

Follow the build order you will implement. Lock targets and limits first, then choose a PWM abstraction, then close inner and outer loops. Check stability across operating points at the end. This order stops us from tuning around modeling errors.

Define control objectives and operating limits earlyClear numeric targets and hard limits prevent tuning gains that look stable in simulation but fail once saturation, faults, or range changes appear.
Select a PWM representation that matches control bandwidthThe PWM model must preserve timing and gain effects that shape phase margin, or control stability results will be misleading even if waveforms look clean.
Build the inner current loop with clear plant assumptionsA current loop stays predictable only when the electrical plant, sensing delay, and filtering are explicit and consistent throughout the model.
Add the outer voltage or power loop with proper separationOuter loops remain stable when their bandwidth is intentionally slower than the current loop, reducing interaction and hidden instability.
Check control stability across operating points and delaysStability must be verified at worst-case voltage, impedance, and delay conditions, not only at nominal operating points.

1. Define control objectives and operating limits early

Write objectives as numbers you can test, not as intentions. Pick the regulated variable, settling time, peak deviation limit, and steady-state error. Define the operating range for DC voltage, grid or load impedance, and any derating rules. Put current, voltage, and duty limits into the model as saturations and clamps. A 5 kW inverter might target 2 ms current settling while capping phase current at 12 A peak and clamping duty if DC drops under 720 V. Add what the controller does at the limit, such as freezing the integrator, back-calculating, or rate-limiting the reference. Write one pass-fail check per objective so tests stay consistent. Clear targets stop you from tuning a waveform that looks clean but violates limits on hardware.

2. Select a PWM representation that matches control bandwidth

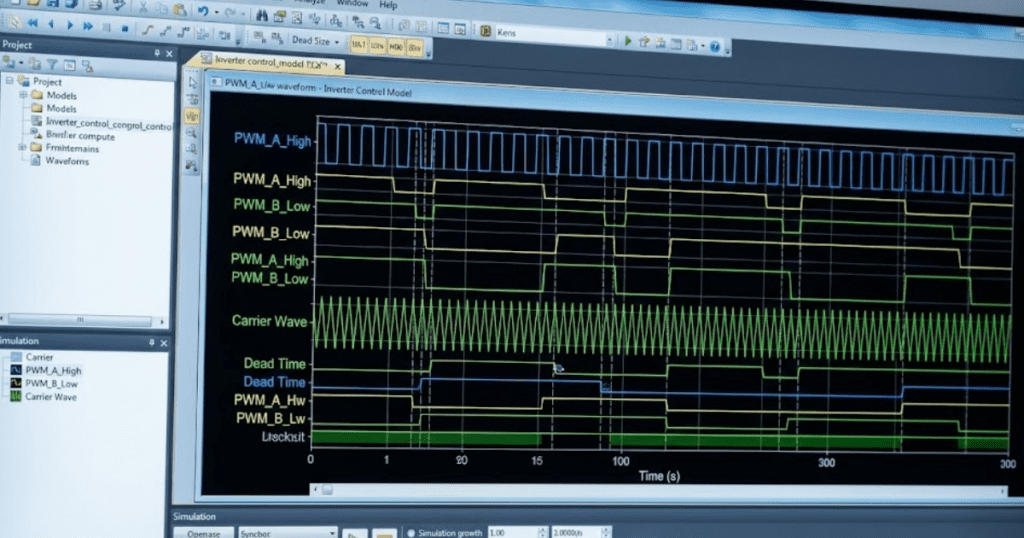
Choose a PWM representation that preserves the delay and gain your controller will see. An averaged modulator fits loop design when crossover stays well below the carrier, but it still needs a duty update delay. A sampled-data modulator matters when bandwidth approaches one tenth of switching, since sample-and-hold lag steals phase. A switching model is for ripple, harmonics, deadtime effects, and filter resonance checks. A 1 kHz current loop with a 10 kHz carrier will tune reliably on an averaged model that includes one control-step delay and the correct modulator gain. Keep a second, switching-level model in SPS SOFTWARE if you want to verify ripple without rewriting the controller. Choose the simplest model that preserves stability margins, then add detail only where results disagree.

3. Build the inner current loop with clear plant assumptions

Inner loop control starts with a plant you can explain in one line. Model the filter you have, then keep the same sign convention and reference frame everywhere. Put sensing delay and filtering inside the feedback path, not as a plotting detail. With an L filter of 2 mH and 0.15 Ω resistance, the plant is close to 1/(Ls + R) before discretization. Discretize at a 50 µs step, then tune PI gains for a crossover near 1 kHz with margin left for delay. If you use an LCL filter, keep crossover well below the resonance peak. Treat any extra filter pole as lost phase you must budget. Add anti-windup early so a current clamp does not turn recovery into a slow drift.

4. Add the outer voltage or power loop with proper separation

Outer loop control will stay stable only when it is slower than the current loop. Pick the outer objective up front, because DC-link voltage control and AC voltage control see different plants. Treat the outer plant as uncertain, since grid strength and load type will vary. Keep the outer bandwidth at least 5x to 10x lower than the current loop so interactions stay small. A DC-link loop at 20 Hz to 50 Hz feeding a 1 kHz current loop will handle load steps cleanly. A grid-forming voltage loop around 100 Hz will still sit below the current loop, but it will require clean voltage sensing. Add rate limits and windup protection so the outer loop does not keep pushing when the inner loop is saturated.

“Choose the simplest model that preserves stability margins, then add detail only where results disagree.”

5. Check control stability across operating points and delays

Check control stability with the full loop, not an ideal diagram. Keep sampling, PWM delay, sensing filters, and saturations inside the loop model when you assess margins. Evaluate worst cases, including minimum DC voltage, maximum power, and a weak-grid impedance point. One stress test doubles grid inductance so an LCL resonance shifts toward crossover. Another test steps current reference into the limit so you see windup and limit cycling. Use loop gain plots to catch phase loss, then confirm with a time-domain step that includes clamps. Aim for margins you can live with after discretization, such as 45° phase margin and 6 dB gain margin. Keep a short regression set so small edits do not silently shrink margins across cases.

Applying these steps to avoid unstable or misleading control results

Unstable results usually trace back to hidden timing or hidden limits. A controller tuned with zero delay will look stable and then ring once a one-step update appears. A controller tuned without saturations will look linear and then stick during faults. Tight models keep these traps visible.

Picture a loop tuned on an averaged plant at 1 kHz crossover. Add a 2 kHz sensor filter and a 50 µs compute delay and phase margin drops. Fix the timing mismatch first, then adjust gains with the same tests each time. Keep three repeatable checks, a current step, a DC sag, and an impedance sweep.

Write assumptions where everyone can see them, then keep them under version control with the model. That habit makes tuning transferable across students, researchers, and product teams. SPS SOFTWARE helps when you need component equations and controller timing exposed so reviews stay concrete. Consistent execution will keep loops calm across operating points.

Electrical Engineering, Simulation

7 Ways To Improve Relay Coordination Studies

Key Takeaways

  • Lock device data and fault levels before coordination tuning starts.
  • Write the primary and backup intents per zone so protection timing remains consistent.
  • Rerun curves and scenarios after each network or setting change to prevent drift.

Relay coordination clears faults fast. Healthy loads stay on. Inputs must be right for time current curves. Clear intent keeps timing steady. Most errors come from stale device data. Copied settings add risk. Curve checks tie results to actual trips. Notes keep settings defensible.

What defines an effective relay coordination study

An effective relay coordination study shows that the correct device trips first in the states you run. Device data and fault levels are verified. Time current curves show the needed separation. Notes explain why pickup and delays exist.

Use a long radial feeder with a midline recloser for testing. End-of-line faults sit near pickup and expose crossings. Coordination that holds at one fault point will fail later. A setting with no reason will force a repeat study.

7 ways to improve relay coordination studies

Lock inputs first. Use curves as checks. Keep each item single. Work in order.

Start with verified system data and consistent short circuit assumptionsRelay coordination fails when device data or fault levels are wrong, so validating inputs first prevents false confidence in curve spacing.
Define protection objectives before touching time current curvesClear primary and backup intent gives protection timing a purpose and prevents random or copied settings.
Establish clear coordination margins across all protection zonesConsistent time margins account for breaker operation, tolerances, and delays so backup devices still wait when they should.
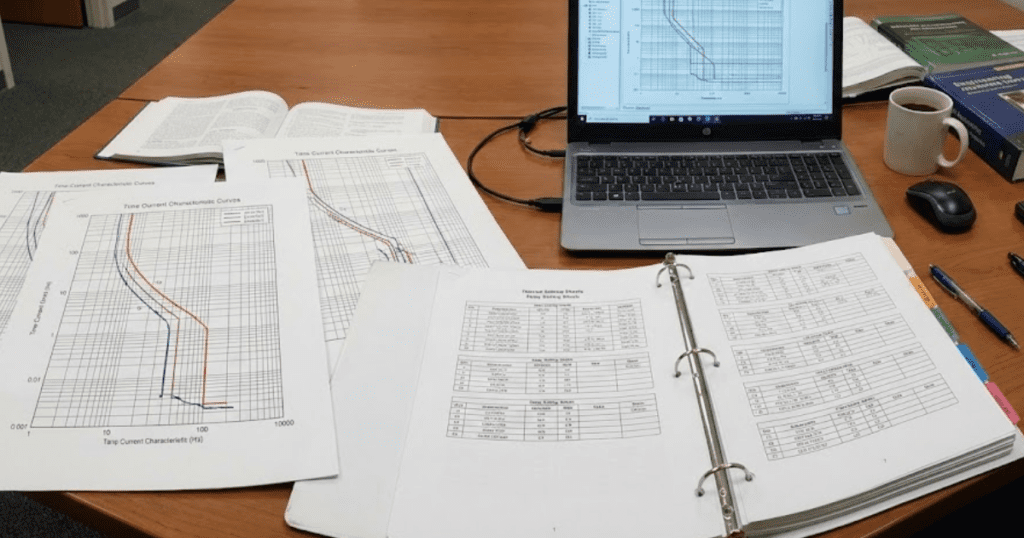
Use time current curves to expose grading conflicts earlyPlotting curves across the full fault range reveals miscoordination that numerical checks alone will miss.
Tune protection timing from the load outward, not relay by relaySetting downstream devices first reduces rework and keeps upstream coordination stable as adjustments are made.
Validate coordination across normal, contingency, and fault casesTesting multiple operating states ensures coordination holds when the system configuration changes.
Reconfirm coordination after setting changes or network modificationsAny system or setting change can disrupt coordination, so rechecking curves helps prevent gradual protection drift.

1. Start with verified system data and consistent short circuit assumptions

Verified inputs are the fastest path to relay coordination. Confirm CT and PT ratios, breaker types, fuse links, xfmr impedances, grounding, and any motor or inverter fault contribution you include. A feeder relay set from a drawing that still shows an old CT ratio will coordinate on screen and trip late on site. Check xfmr tap position and source strength so short circuit levels match what the yard will see. Keep one fault basis for the tuning run so every time current curve uses the same fault levels. Track a source and date for each device record so updates don’t become guesswork. Rerun remote-end faults on long feeders after every model update, because weak faults always expose curve crossings first.

2. Define protection objectives before touching time current curves

Protection timing only makes sense after you state the protection objective. Write which device must act first for each zone and fault type, and what backup action you accept if the primary fails. A fuse-saving feeder will use a fast reclose shot, while a cable feeder will avoid reclosing and accept slower backup. If arc-flash limits matter, note the maximum acceptable clearing time at each bus before tuning. Those choices set pickup, delay, and instantaneous reach. An upstream relay should wait for downstream devices to report line faults, but act quickly for bus faults. Without it, settings get copied and schemes drift quietly later. Keep the objective note beside the time-current curves so “faster” requests don’t compromise selectivity.

“Without it, settings get copied and schemes drift quietly later.”

3. Establish clear coordination margins across all protection zones

Coordination margins turn “curves don’t touch” into “backup still waits in service.” Build in room for breaker opening time, fuse-clearing spread, relay tolerances, CT saturation, and any logic delay you add. Don’t forget breaker failure timers, since they add delay to backup clearing even when curves look clean. A lateral fuse with wide melt and clear scatter needs more spacing than a digital relay with tight timing. A recloser fast shot can erase margin if it lands in the same current range as the fuse. Pick one margin rule and apply it across all zones so you don’t end up with one-off exceptions. More margin reduces nuisance trips, but slows backup clearing and raises fault energy when the primary fails.

4. Use time current curves to expose grading conflicts early

Time-current curves are most valuable when used to identify grading conflicts early. Overlay each primary device with its backup and scan the full current range, including minimum fault current near the end of the feeder. A xfmr fault can land between pickup and instantaneous and hide a crossing unless you plot that case. Curve crossings near pickup are common on long feeders and high-impedance faults, so don’t stop at high-current points. Instantaneous elements set too low can jump ahead of downstream devices during close-in faults. Mark the currents where coordination must hold so your review stays consistent. When a conflict appears, fix the cause first, such as pickup, delay, or instantaneous reach, before you spread changes everywhere.

5. Tune protection timing from the load outward, not relay by relay

The cleanest tuning flow runs from the load outward. Set laterals and branch devices first, then set the midline recloser or sectionalizer, then set the feeder relay, and finish with upstream backup. A radial feeder often needs lateral fuses to clear single-phase faults while the main recloser clears temporary faults on the trunk. Starting upstream first forces you to revisit every downstream curve after each tweak. Downstream pickup must ride through load pickup and xfmr energization, or nuisance trips will dominate your tuning time. Cold load pickup after an outage can also look like a fault, so check it first before you tighten pickup too. After downstream settings stabilize, upstream edits become small, and the coordination picture remains readable.

6. Validate coordination across normal, contingency, and fault cases

A study that only checks the normal one-line will miss the states that break coordination. Test feeder ties open and closed, a xfmr out of service, minimum and maximum source strength, and generation connected and disconnected. A tie closure can reduce the fault current seen by a downstream device and push it into a slower part of its curve. A generator can reverse current and trip a non-directional element for an upstream fault. Run one weak-fault case and one close-in case so you see both pickup timing and instantaneous reach. Keep the scenario set short but strict, and rerun it after every tuning change. SPS SOFTWARE helps when you need physics-based network behavior and editable protection logic in the same workspace.

7. Reconfirm coordination after setting changes or network modifications

Coordination will drift after every change, even when relay settings stay the same. A new cable, a feeder extension, grounding changes, added capacitance, or a different breaker model will shift fault levels and clearing times. A feeder extension often drops minimum fault current, so end-of-line faults sit closer to pickup and expose curve crossings. A quick setting tweak to stop a nuisance trip can remove spacing you relied on for backup. Keep the previous setting file and curve set so you can roll back if a field test reveals a new problem. Treat updates like controlled changes and record the reason, affected devices, and fault cases rerun. Replot the time current curves after each modification so you can see what moved

Applying these methods to new studies and existing protection schemes

Applying these methods works best when you treat relay coordination as a controlled engineering process rather than a one-time calculation. New studies benefit from a clean sequence where data validation, protection intent, margins, and tuning order are fixed before any curves are adjusted. That structure prevents early choices from forcing compromises later and keeps coordination defensible during reviews.

Existing schemes require more discipline because history works against you. Legacy settings often reflect past outages, rushed fixes, or copied logic from similar feeders. Start by rebuilding the coordination logic using current system data rather than trusting inherited curves. Plot fresh time current curves and compare them against actual operating scenarios, not just the conditions assumed when the settings were first applied.

“That habit keeps reviews short.”

Documentation matters as much as settings. Each pickup, delay, and instantaneous choice should tie back to a protection objective and a verified fault case. When system changes occur, that record makes it clear what must be rechecked and what can remain untouched. Teams using SPS SOFTWARE often keep models, assumptions, and curves linked, which shortens reassessment cycles and reduces debate during approvals.

Over time, disciplined execution shapes outcomes. Coordination schemes that remain stable do so because engineers repeatedly apply the same checks, not because the system stays simple.

Modelling, Simulation, Student, University

6 Ways To Bring Modern Modelling Into The Classroom

Key Takeaways

  • Digital labs work best when each run has a fixed check and a required explanation.
  • Inspectable models and scaled exercises build consistent habits for testing and debugging.
  • Templates and validation test cases keep modelling activities teachable across class sizes.

Modern modelling will make your labs teach understanding, not button clicks. Digital labs let students change parameters and explain waveforms. You’ll grade exercises with checks, not guesswork. Lab reports will improve.

Engineering teaching uses models on paper, so simulation models fit. The update treats a model like an instrument to verify and stress. Teaching support needs an update because students learn faster with one workflow. That shift modernizes modelling labs without turning class time into tool training.

Why modern modelling belongs in engineering teaching today

Modern modelling belongs in engineering teaching because it links theory to visible behaviour. Students will see how parameters, controls, and disturbances alter voltages and currents. That clarity will reduce copying and raise the quality of explanations. Labs get easier to repeat across semesters.

A useful lab pattern starts with a claim, then asks students to prove it with the model. A fault study can require a predicted first-cycle current, a simulated result, and a short explanation of the gap. Students can pinpoint the cause by checking source impedance and measurement points. That habit builds skepticism and engineering judgment.

6 ways to bring modern modelling into the classroom

These six changes modernize modelling activities without adding weekly hours. Each item ties an exercise to visible response and a check. Pick two items next lab cycle, then expand once grading feels stable. Stronger explanations will show up fast.

“A useful lab pattern starts with a claim, then asks students to prove it with the model.”

Replace static lab manuals with interactive digital lab workflowsStudents learn more when labs require them to test changes, capture results, and explain outcomes instead of following fixed instructions.
Use open, inspectable models to teach system behavior step by stepAllowing students to see inside models helps them trace cause and effect and build debugging skills rather than guessing.
Design modelling activities that connect equations to system responseLinking calculations to simulated waveforms teaches students to validate theory and question mismatches instead of accepting plots at face value.
Scale student exercises from simple blocks to full system studiesGradually expanding a single model across labs builds confidence and reinforces how small subsystems combine into larger systems.
Blend offline simulation with controller and system validation tasksTreating models as test benches trains students to think in test cases and limits, not just nominal operation.
Support instructors with reusable templates and assessment-ready modelsStandardized templates reduce grading effort and keep modelling labs consistent across sections and semesters.

1. Replace static lab manuals with interactive digital lab workflows

Static manuals push copy steps, while a digital lab workflow forces evidence at each stage. A simple structure works well: run a baseline, change one variable, then explain the delta using plots and values. A workflow can live as a versioned model folder with a checklist and a results file. Students will submit the model plus labeled plots with units and captions, not screenshots.

A motor start lab can ask three runs: rated voltage, 90% voltage, and higher inertia. The checklist can require the same axes, the same time window, and one metric such as peak current. Setup time is the tradeoff because file naming and storage must be consistent. That effort pays back when grading speeds up and disputes drop.

2. Use open, inspectable models to teach system behavior step by step

Students learn faster when they can open a model, see assumptions, and trace cause to effect. Inspectable models teach debugging because students can follow signals and states instead of guessing during lab time. A good lab starts with a small readable model and adds one feature per step. Each step should include one check that proves nothing else changed.

A converter lab can begin with an averaged switch, then add a switching bridge, then add a filter, and finally add control. Each step can require a power balance check or a ripple measurement. SPS SOFTWARE works well when students inspect structure and parameters instead of treating blocks as magic. Cognitive load is the constraint, so optional detail should stay hidden.

3. Design modelling activities that connect equations to system response

Modelling works best when students carry one equation from paper to plot, then explain the gap. The model becomes a test bench for assumptions about linearity, saturation, and time constants. Students will stop treating plots as truth and start asking what the model implies. That practice shows up later in design and fault finding.

An RL step response is a clean example: students compute the time constant, predict the 63% rise time, then measure it from the simulated waveform. A second run can add a sensor filter and ask for a revised calculation and plot. Scope control matters, so keep the math short and the measurement method explicit. Grading gets easier because the explanation matters more than a perfect value.

4. Scale student exercises from simple blocks to full system studies

Students build confidence when exercises scale in a planned sequence instead of big jumps. A scalable sequence reuses the same base model and grows it in layers, so students practice refactoring. Each lab should add one new concept and one new failure mode to diagnose. That structure also helps you pinpoint where a cohort gets stuck.

A protection sequence can start with a source and load, then add a line, then add a fault, and finally add relay logic. Measurements can stay constant, while each week adds one plot such as trip time or negative-sequence current. Planning is the tradeoff, because you’ll need the end state defined early. Students still struggle, but the struggle stays focused and teachable.

5. Blend offline simulation with controller and system validation tasks

A modern lab treats the model as a place to validate control logic and system limits, not just to get waveforms. Students will think in test cases: nominal operation, disturbance, fault, and recovery. The controller can be simple, but timing and saturation need to be modeled. Students learn to ask what breaks first and why.

A grid-tied inverter exercise can ask students to tune a current controller, then test a voltage sag and a phase jump. A second pass can add measurement noise and a slower sampling rate, then require a justified retune. More variables are the tradeoff, so defaults must be fixed and changes must be limited. That discipline produces cleaner comparisons and better reasoning during grading week.

6. Support instructors with reusable templates and assessment-ready models

Teaching support keeps modelling labs teachable at scale. Templates make grading consistent, protect lab time, and help new instructors run the same lab with fewer surprises. Assessment-ready models also support integrity because student edits are visible and checkable. You’ll spend less time hunting files and more time reading explanations.

A template can include standard measurements, a plot generator, and a results page that pulls key metrics. A check script can flag missing labels, unit errors, and unsaved runs on submission. A starter model can keep the test bench fixed while students edit parameters and logic blocks in marked areas. Maintenance is the tradeoff, since templates need updates when objectives shift.

“Students will think in test cases: nominal operation, disturbance, fault, and recovery.”

Choosing the right mix of modelling activities for your course goals

The right mix depends on what you want students to do without you nearby. Start with one outcome you can grade cleanly, such as explaining a waveform change using model evidence. Then pick the lab pattern that fits that outcome and keep everything else fixed for the first run. Students trust labs when the rules stay stable.

Class size and lab access matter. Large groups need templates and checks, while small groups can spend more time debugging. A one-page lab contract helps: allowed edits, required plots, one pass or fail check. A modelling platform only helps if your course rewards clarity and verification, and SPS SOFTWARE works best as the shared workspace that keeps labs consistent.

Simulation

7 Ways Researchers Use EMT Simulation for Published Work

Key Takeaways

  • Electromagnetic transient simulation helps you move from rough ideas to credible, repeatable studies that align with the expectations of peer review and thesis committees.
  • Careful research modelling with EMT focuses on the right level of detail, linking device physics, control behaviour, and grid conditions to clear performance metrics.
  • Structured EMT studies support paper ready simulation by producing clean, consistent waveforms and datasets that can be reused across several publications and projects.
  • Well documented EMT models, with clear assumptions and parameter sets, strengthen academic workflows and make it easier for students and collaborators to contribute.
  • Sharing EMT projects and data as part of research culture supports reproducible work, strengthens trust in results, and creates a foundation for future studies.

You spend weeks tuning a model, then still wonder if the waveforms will stand up in peer review. Electromagnetic transient (EMT) simulation gives you a way to test ideas, capture subtle behaviour, and build confidence before results ever reach a journal editor. Instead of relying on simplified assumptions, you can study switching detail, non linearities, and control interactions at the same time as you refine your research questions. Used well, EMT tools turn a rough concept into a repeatable study that supports clear, defensible conclusions.

For many researchers, the challenge is not access to software but structuring models so they lead naturally to publishable results. Questions arise about how detailed a feeder must be, how to document protection settings, and how to justify the chosen time step to reviewers. Careful EMT studies help you answer those questions while keeping a clear link between equations, parameters, and the story your paper needs to tell. When EMT workflows line up with academic expectations, you spend less time repairing models and more time interpreting what your system is actually doing.

How researchers use EMT simulation to prepare accurate studies

Accurate EMT studies start with a clear statement of what you want to measure and why that quantity matters for the paper. Instead of building a huge model first, many experienced researchers treat EMT simulation as an extension of their analytical work, checking assumptions step by step. That approach keeps the model focused on specific waveforms, time scales, and operating points that link directly to claims in the text. It also reduces the temptation to include every device and feeder section, which often makes simulation harder to explain and validate.

Once the study goal is clear, attention shifts to model fidelity and numerical choices. Device models must reflect the physics that influence the results you plan to publish, especially in converter dominated networks. Time step, solver settings, and switching schemes all affect whether the waveforms shown in the paper match what a peer could reproduce. When you treat EMT simulation as a way to design paper ready simulation campaigns instead of isolated runs, each study becomes easier to document, justify, and defend.

7 ways researchers use EMT simulation for published work

Careful EMT work links detailed waveform data to research questions about stability, power quality, and control performance. Researchers often rely on electromagnetic transient simulation when RMS tools cannot capture switching events, fast protection, or detailed converter behaviour. The same model may support several studies, for example by sweeping operating points or controller gains. Well planned EMT studies shorten the distance between a project idea and a set of figures that can stand up in review.

Summary of EMT use cases for published work

#EMT use caseTypical study goalExample outputs for papers
1Converter and inverter switching behaviourValidate switching patterns and current stressPhase currents, device voltages, switching transitions
2Faults and protection coordinationShow protection timing, selectivity, and mis‑operationCurrent and voltage during faults, relay signals, trip times
3Renewable and microgrid interactionExplain control interactions and grid impactsFrequency, voltage, converter currents, point of common coupling waveforms
4Control strategy and tuning assessmentCompare control variants and tuning choicesStep responses, harmonic content, stability margins
5Parametric EMT studiesMap sensitivity to parameters and operating pointsFamilies of waveforms, metrics versus parameter plots
6Paper ready simulation figuresProduce clean figures and datasets for publicationHigh resolution plots, harmonics, statistical summaries
7Reproducible research and sharingSupport replication and extension of studiesModel archives, configuration files, reference datasets

Careful planning of these applications helps you create EMT studies that serve more than one purpose during a research project. A model built for one use case often becomes the foundation for several related publications. When you structure the model, data exports, and documentation with this reuse in mind, research modelling becomes far more efficient. This mindset also supports students in your group, who can build on existing EMT projects instead of starting from scratch each term.

“Electromagnetic transient (EMT) simulation gives you a way to test ideas, capture subtle behaviour, and build confidence before results ever reach a journal editor.”

1. Modelling converter and inverter switching behaviour

Converter and inverter projects often reach a limit with averaged models, especially when reviewers ask about device stress or switching induced distortion. An EMT model that includes detailed switching patterns, gate signals, and snubber networks lets you answer those questions directly. You can study how layout choices, modulation schemes, and dead time affect voltage overshoot or current ripple. That level of detail turns vague statements about “switching effects” into plots that quantify exactly what happens during each transition.

For published work, this type of model supports clear justification of design limits and safety margins. Current peaks at turn on and turn off can be compared with device ratings, and you can show how proposed changes reduce stress. High frequency details that would be invisible in RMS simulations now appear as precise, time aligned traces. When you base claims on these EMT waveforms, reviewers see a clear chain from modelling assumptions to measured quantities and final interpretation in the paper.

2. Studying faults and protection coordination in complex networks

Protection studies are a classic area where electromagnetic transient models shine. Short circuit events, high impedance faults, and breaker operations all involve fast transients and non linear conditions that simplified tools often smooth out. EMT studies let you trace how fault currents propagate through feeders, transformers, and converters, giving a clear picture of what each protection device actually sees. That level of insight helps you explain both successful operations and problematic cases in your publication.

Protection coordination research also benefits from direct access to relay logic and measurement paths inside the simulation. You can inject noise, CT saturation, and sampling effects to show how algorithms behave under stress. Trip times, mis operations, and security margins can then be quantified and linked to specific waveform segments. When you document these elements carefully, the protection section of your paper moves beyond settings tables and provides a convincing explanation of how the scheme behaves under challenging conditions.

3. Analysing renewable integration and microgrid behaviour

Converter dominated grids and microgrids bring questions about stability, power quality, and interaction between many local controllers. EMT simulation lets you observe how grid forming and grid following converters react to faults, load steps, and changes in renewable generation. You see not only average power flow but also oscillations, harmonics, and phase relationships that influence protection and control. This view is especially important when you want to explain incidents that simpler models cannot reproduce.

For published studies on microgrids and renewable integration, readers expect evidence that the proposed control or topology works under a range of operating conditions. EMT models support this by letting you test weak grids, unbalanced loads, and abrupt disconnection events with consistent numerical settings. You can show how droop settings, virtual impedances, or current limits affect recovery behaviour and service continuity. When those results appear in plots and tables, they give reviewers tangible evidence that the proposed approach can manage realistic scenarios.

4. Comparing control strategies and tuning methods

Researchers often propose new control schemes or tuning rules, then need to show clear benefits over established approaches. EMT simulation gives a strict test bench where control algorithms see the same plant, disturbances, and noise. This makes it easier to compare settling time, overshoot, harmonic content, and resilience to parameter variation. Each controller variant can be implemented with access to the same internal states, which helps align the discussion around measurable outcomes.

For example, you might compare two current control strategies for a grid connected converter using identical fault events and load steps. EMT results then show how quickly each scheme stabilizes currents, restores voltage, or respects limits. Those waveforms can be condensed into error norms or quality indices that fit well in a research paper. When readers see that every control variant faced the same EMT scenarios, they are more likely to trust the conclusions you draw.

5. Running parametric EMT studies for sensitivity and robustness

Many projects need evidence that a design holds up across a range of parameters instead of just one operating point. EMT studies support this by letting you automate sweeps of controller gains, line impedances, filter values, and load levels. For each case, you can track metrics such as harmonic distortion, overshoot, settling time, or energy through key components. This creates a structured picture of sensitivity that is hard to obtain from the laboratory alone.

Such parametric research modelling, when planned early, lines up closely with the tables and plots needed for journal or conference publications. Instead of hand picking a few “good looking” cases, you work from a pre-defined grid of scenarios. The resulting datasets can be post processed into surfaces, contour plots, or summary statistics that directly support your main arguments. Reviewers then see that the proposed design or method maintains performance across the tested range, which adds weight to claims about robustness.

6. Producing paper ready simulation figures and datasets

Even the strongest concept can struggle in review if the figures are noisy, inconsistent, or poorly labelled. EMT tools can act as a source of paper ready simulation data when you configure output channels, sampling rates, and naming conventions with publication in mind. You can align axes across all figures, keep fonts and units consistent, and extract only the time windows that illustrate the effect you care about. This preparation turns raw waveforms into clean visuals that support your narrative instead of distracting from it.

Beyond figures, EMT projects can output data in formats suited for sharing and further analysis. Time series can be exported for statistical work, spectral analysis, or comparison with measurement campaigns. When you attach these datasets as supplementary material, other researchers gain a stronger basis for replication or extension. That attention to detail signals that the study is not only correct but also carefully prepared for academic scrutiny.

7. Supporting reproducible research and open model sharing

Reproducible research depends on more than just equations in the text. EMT models, configuration files, and test scripts often contain the practical details that allow another group to regenerate your results. When these elements are organised and shared, peers can validate study claims, explore new parameter ranges, or adapt the model to different systems. This practice strengthens the impact of your work and reduces the chance that important insights stay locked in a single lab.

EMT projects are well suited to this style of research because they gather topology, parameters, control code, and measurement points in one workspace. You can store model versions alongside predefined test cases that match the figures and tables in your paper. Clear naming, documented assumptions, and simple instructions lower the barrier for others who want to reuse the model. Over time, this approach builds a body of EMT work that supports collaboration across institutions and successive cohorts of students.

Well scoped EMT applications help you move smoothly from concept, to simulation, to publishable evidence. Each use case adds a layer of confidence, from device physics and protection timing to control performance and long term reliability. When those layers connect through clear modelling and documentation, peer reviewers can follow your reasoning without guessing about hidden assumptions. This structure also makes it easier for your future self, and for students in your group, to extend the project into new studies.

How EMT models support clear documentation for academic workflows

Clear documentation matters as much as numerical accuracy when EMT work feeds into academic workflows. Reviewers want to see not only waveforms but also how models were built, tuned, and validated. Students and collaborators need a way to understand your choices without hours of one to one explanation. Good documentation habits inside the EMT model itself make these expectations easier to meet.

  • Structured project hierarchy: A consistent folder and subsystem structure lets readers see where feeders, controllers, and protection elements live. When each major function has a clear place, new users can trace signal flow and add their own components without confusion.
  • Documented model assumptions: Text blocks, notes, or attached documents that explain simplifications and modelling boundaries save time during review. Readers can see which parasitics, thermal effects, or control delays were ignored and why that choice made sense for the study.
  • Parameter sets linked to test cases: Storing parameter files or masks for specific scenarios avoids guessing later about which values produced which figures. This practice helps you match model states to particular EMT studies and supports quick regeneration of plots if a reviewer asks for clarifications.
  • Clear naming for signals and scopes: Using descriptive names for measured quantities and scopes reduces errors when preparing figures. A consistent naming scheme also helps students avoid mixing up phases, reference frames, or control variables when they export data.
  • Embedded references and cross links: Notes that point to equations in your paper, or to earlier reports that justified certain parameters, connect the simulation to a broader research context. These links guide readers who want to understand not only how the EMT model runs but also why it has its present form.
  • Version information and change logs: A short log of changes, with dates and reasons, makes it easier to track which version matches which submission. That history becomes invaluable when you revise a paper months later and need to confirm the exact model that produced a specific waveform.

When EMT models carry this kind of documentation, they shift from private working files to shared academic assets. Supervisors can review work more efficiently, since they can inspect assumptions and parameters without rebuilding the model. Students gain confidence that their projects will still make sense to them at the end of a degree or thesis. Reviewers see a level of care that builds trust in both the methods and the published results.

“Well scoped EMT applications help you move smoothly from concept, to simulation, to publishable evidence.”

How SPS SOFTWARE supports research modelling and academic publication

SPS SOFTWARE is designed to help engineers and researchers move from concept to publishable EMT studies with less friction. Open, physics based component models give you a clear view of equations and parameters, which is essential when reviewers ask for justification. You can build detailed converter, feeder, or microgrid models while keeping structures readable for future collaborators. This supports research modelling that feels like an extension of your analytical work instead of a separate, opaque step.

SPS SOFTWARE also aligns with teaching and lab workflows where several people share and adapt the same EMT projects. Project files, component libraries, and example templates give students and colleagues a consistent starting point that still allows deep customisation. Data export options help you create clean figures, tables, and supplementary datasets suited to journal and conference expectations, so paper ready simulation becomes a normal outcome of modelling rather than a last minute scramble. The platform gives you practical tools to connect day to day modelling with reliable, trustworthy academic results.

Simulation

5 Optimization Tips for Large-Scale SPS Models

Key Takeaways

  • Large SPS Software models only become useful for real-time work when structure, solver settings, and data handling are tuned with the same care as the electrical design itself.
  • Simplifying hierarchy, selecting the right solver strategy, and replacing non-essential detailed components with reduced models can cut run times significantly without sacrificing the physics that matter.
  • Profiling is a practical way to see where simulations actually spend time, which helps you focus optimization on specific subsystems, control loops, and logging choices that have the biggest impact.
  • Careful management of sampling rates, timing margins, and memory usage improves both numerical accuracy and throughput, so you can run more scenarios and gain clearer insight from each one.
  • SPS Software provides an integrated workflow for MATLAB model optimization, helping engineers, educators, and researchers move large simulation models from offline analysis to real-time targets with confidence.

Every engineer who has watched a progress bar crawl during a long simulation knows how painful a slow model feels. Large SPS Software models can be rich in detail, yet that complexity often causes missed real-time deadlines and stalled work. You might have controllers waiting on signals, processors pegged at full utilisation, and hardware-in-the-loop setups that simply cannot keep up. Tuning those large simulation models for speed and robustness turns frustration into predictable timing, cleaner results, and calmer test days.

Power systems engineers, power electronics specialists, grid planners, and researchers all feel this pressure when models grow beyond a few thousand states. You need accurate physics-based behaviour for feeders, converters, or microgrids, yet you also need simulations that finish before the lab closes. That balance becomes even more sensitive once SPS Software models feed hardware platforms for hardware-in-the-loop or real-time validation. Teams in academia and industry face offline queues, limited real-time access, and higher expectations for system studies, which puts extra weight on every modelling choice.

“Tuning those large simulation models for speed and robustness turns frustration into predictable timing, cleaner results, and calmer test days.”

Why optimizing large-scale SPS Software models is critical for real-time performance

Large-scale SPS Software models often start life as exploratory studies, with high detail everywhere and little thought given to solver cost. That structure works for overnight runs on a workstation, but the same model typically exceeds the time budget once you target a real-time processor. Every extra state, discontinuity, and algebraic loop adds work for the solver, and that effort shows up as missed step deadlines and jitter. During hardware-in-the-loop work, those overruns can stop tests, upset controllers, or hide faults that only appear when timing is correct. Optimizing large simulation models at this stage means shaping them so each time step finishes within the real-time window, while still reflecting the physics you care about.

Real-time performance is not just about raw speed, because accuracy suffers if the solver cuts corners to stay on schedule. Faster models let you sweep more scenarios, stress controllers over longer time spans, and test rare edge cases that might never show up in a single long run. Once results match across offline and real-time runs, you gain confidence that any failure you see comes from the design, not from numerical artefacts or overloaded processors. This combination of timing reliability and trustworthy waveforms is what turns SPS Software optimization from a pure performance exercise into a foundation for better engineering judgement.

5 optimization tips for large-scale SPS Software models

Effective SPS Software optimization starts with a clear view of where simulation time actually goes. Some of that cost comes from how you structure the model, and some comes from solver settings or data handling choices. Small structural changes in SPS, especially for large simulation models, often yield bigger gains than switching hardware or adding processing cores. Optimisation work that targets structure, solvers, components, profiling, and data handling usually fits directly into the way you already build and test models.

1. Simplify model hierarchy to reduce solver load

Complex hierarchy is often the first hidden source of cost in SPS models built on top of MATLAB and Simulink diagrams. Deep nesting of subsystems, conditional subsystems, and masked components forces the engine to manage many execution contexts, even when electrical behaviour remains simple. Bringing related blocks into flatter, well-grouped sections reduces that overhead and makes execution order easier to reason about. You still keep logical separation for teaching or documentation, while the solver sees fewer layers to walk through at each step. Many teams create a clean top level dedicated to power system structure, then push only essential reusable logic into subsystems with clear naming and minimal nesting.

Large grid or converter studies often include repeated feeders, load banks, or converter legs that share the same structure but differ in parameters. Creating parameterised subsystems for these patterns gives you one place to tune structures while avoiding extra depth from excessive grouping. You can also remove layers that only serve visual layout, such as subsystems used purely to box blocks on the screen, replacing them with annotations or area highlights. This type of clean up helps students and junior engineers read the model faster, which reduces modelling errors that later show up as unstable real-time runs. Structured hierarchy that stays shallow but clear becomes easier to port to hardware targets and to share across academic or industrial teams.

2. Use variable-step solvers efficiently for faster simulation

Variable-step solvers help accelerate offline SPS runs by adapting the time step when signals change slowly, yet they still require careful configuration. Loose error tolerances, stiff systems, or many fast switching elements can cause step chopping that undermines performance gains. Start from recommended solver settings for your mix of electrical and control components, then tighten tolerances only where they affect results that matter for your study. Engineers often see major MATLAB model optimization wins simply by measuring step sizes over time and avoiding extreme fluctuations that indicate solver stress. Once the offline model behaves well, you can switch to an equivalent fixed-step configuration for real-time work with fewer surprises.

For large simulation models that mix slow electromechanical dynamics with fast switching or protection logic, consider partitioning components across multiple solver rates. Slow states such as mechanical shaft dynamics or averaged grid equivalents can use longer effective steps, while switching and protection elements run on shorter steps only where needed. This type of multi-rate strategy reduces the number of tiny integration steps that otherwise propagate across the entire system. You can then validate accuracy with time-domain overlays, frequency-domain comparisons, or power balance checks to ensure that solver tuning has not hidden important behaviour. Iterating in this structured way keeps solver choice aligned with physics rather than chasing trial-and-error settings.

3. Replace detailed components with equivalent simplified subsystems

High fidelity component models feel comforting, yet full switching models for every converter leg or detailed network for every feeder quickly overload real-time targets. Averaged models, Thévenin equivalents, or reduced-order machines often capture the behaviour you need while cutting states and discontinuities dramatically. For example, a cluster of photovoltaic inverters feeding a common bus can share a single averaged interface plus a smaller set of detailed models used only where switching artefacts matter. When models support teaching, you can preserve detailed views in separate subsystems and offer simplified equivalents as the default for performance. Students still learn how the full circuit behaves, while lab sessions remain practical on shared real-time hardware.

Simplification works best when guided by clear questions about what outputs matter and which inputs drive those outputs most strongly. If your objective is to validate controller behaviour for fault scenarios, the model must preserve fault timing, voltage and current envelopes, and any nonlinearities that influence controller decisions. Fine detail in remote parts of the network or secondary subsystems often contributes little to those quantities and can move into simpler equivalents. Documenting these choices directly in the model, for example through annotations or variant controls, helps future users understand the limits of each configuration. Clear justification for each simplified subsystem also reassures reviewers and project sponsors that performance gains do not hide important physics.

4. Profile model execution to identify computational bottlenecks

Profiling tools in MATLAB and Simulink give a concrete view of where simulation time is spent for SPS models. Instead of guessing which part of a large diagram is slow, you see exact functions, subsystems, and blocks that consume the most steps or CPU cycles. Engineers often discover that a few oscillating control loops, high-frequency measurement filters, or diagnostic scopes account for a large share of runtime. Removing unnecessary logging, simplifying control logic, or retuning filters in those locations typically delivers bigger gains than blanket changes to the entire model. Profiling also reveals parts of the model that never execute during a given scenario, which may signal dead code, unused protection paths, or features that should move into separate test cases.

Real-time preparation benefits from profiling across multiple test cases, such as normal operation, faults, and start-up sequences. Some bottlenecks only appear during limit cycles or edge scenarios, so it helps to profile those paths before deploying to hardware. You can store profiler results alongside the model, which lets team members review past decisions on solver choices and subsystem restructuring. This shared context prevents repeated tuning work and builds confidence that optimizations are based on measured data rather than intuition alone. Profiling becomes part of the modelling culture, much like unit testing for software, which improves quality across projects over time.

5. Pre-allocate data and manage signal logging for memory efficiency

Memory usage often limits large SPS models before pure computation does, especially when many signals log to the workspace or external files. Logging every waveform at full resolution for long scenarios creates enormous datasets that slow down both simulation and post-processing. You can usually keep only key currents, voltages, and controller states at full rate, while decimating secondary signals or logging them only around specific events. Model-based logging controls, signal groups, and conditional scopes make it easy to switch between lightweight debug configurations and richer traces used for detailed studies. Keeping memory footprints modest reduces the risk of overruns on real-time targets and shortens the delay between test runs in the lab.

Pre-allocating arrays in MATLAB functions or scripts connected to your SPS models avoids costly memory growth during simulation. Growing variables one sample at a time inside control logic or data logging callbacks forces the engine to request new memory repeatedly. You can estimate required sizes from expected simulation length and sample times, then allocate once and reuse buffers across cases. This approach keeps memory access patterns predictable and helps real-time schedulers maintain consistent performance. Clean memory management pairs well with good logging practice to support longer, more informative test campaigns without frequent resets or manual cleanup.

Consistent SPS Software optimization across hierarchy, solvers, components, profiling, and data handling turns large models into reliable tools rather than fragile experiments. Each improvement may appear small in isolation, yet taken across an entire project they often cut simulation time by factors, not just percentages. Shorter, more stable runs free scarce real-time hardware for more users, more scenarios, and more ambitious studies. That improvement in throughput and confidence pays off in smoother lab schedules, clearer teaching sessions, and stronger validation for industrial projects.

“Consistent SPS Software optimization across hierarchy, solvers, components, profiling, and data handling turns large models into reliable tools rather than fragile experiments.”

How optimization improves accuracy and simulation throughput in real-time systems

Model optimisation work often starts with performance targets, yet it has direct consequences for accuracy as well. Poorly tuned solvers, inconsistent sampling, or overloaded tasks can distort waveforms even when a run appears to finish on time. Careful SPS Software optimization keeps numerical error, latency, and jitter within known limits, so that comparisons between offline and real-time runs remain meaningful. The benefits show up in several concrete ways for engineers, students, and researchers working with real-time targets.

  • Higher numerical fidelity: Tight control of solver settings reduces integration error, so voltage and current traces stay closer to analytical expectations. This fidelity makes it easier to spot small controller issues, such as marginal stability or subtle overshoot, before hardware testing.
  • More consistent timing: Optimised models meet step deadlines with margin, which keeps sampling instants aligned with controller assumptions. Consistent timing avoids artificial oscillations introduced purely by jitter, so faults and events occur when you expect them to.
  • Greater scenario coverage per day: Faster simulations let you run more load levels, fault cases, and parameter sweeps within the same lab slot. Higher throughput translates into better statistics and stronger confidence when presenting results to peers, managers, or examiners.
  • Easier comparison between offline and real-time runs: When both versions of the model behave similarly, you can use offline studies to narrow down parameter ranges before moving to hardware. This alignment saves time on setup, reduces debugging effort, and clarifies which differences truly come from the target hardware.
  • Improved hardware utilisation: Efficient models make better use of limited real-time processors and chassis, so teams can share platforms without long waiting lists. Engineers spend more hours testing designs and fewer hours waiting for a free slot, which improves learning and project progress.
  • Clearer teaching and training outcomes: Students working with responsive models see the link between theory and waveforms within a single lab session. That immediacy helps concepts stick, encourages experimentation with settings, and builds confidence for future industrial projects.

Optimisation that improves both accuracy and throughput directly supports better engineering understanding and safer decision paths. You spend more time interpreting clear results and less time questioning solver behaviour or re-running unstable cases. Teams that measure these gains often find that simulation becomes a trusted part of design and validation, not just a preliminary check before experiments. Over time, well-optimised SPS workflows create a shared language of waveforms, timing margins, and performance targets that links classrooms, research labs, and industrial projects.

How SPS Software supports engineers in optimizing models

SPS Software gives modelling teams a familiar MATLAB and Simulink workflow with power-focused libraries that already reflect how electrical engineers think about systems. Open, physics-based component models let you inspect equations, adapt parameters for local grids or converters, and teach students exactly what each block computes. Because SPS Software integrates cleanly with model-based design flows, you can use the same diagrams for offline studies, automated parameter sweeps, and preparation for real-time targets. That continuity reduces rework and gives both professors and engineers a single modelling language to share across courses, research projects, and applied studies. When models scale toward real-time, SPS users can draw on established workflows for hierarchy management, solver tuning, and profiling that align with the optimization steps described earlier.

Engineers working with OPAL-RT hardware often pair SPS Software models with dedicated real-time solvers, so optimization work in SPS maps directly to gains on the target simulator. Academic labs can share example models, courseware, and profiling templates across institutions, strengthening teaching while keeping local setups affordable. Industrial teams benefit from the same transparency when they transfer models from feasibility studies into hardware-in-the-loop rigs, since every simplification or solver tweak remains visible and reviewable. This combination of open models, consistent workflows, and clear optimization practices positions SPS Software as a dependable companion for engineers who care about both understanding and performance. Teams can trust that time invested in tuning SPS models supports better teaching, more credible research, and safer industrial decisions year after year.

Grid, Simulation

How Simulation Strengthens Grid Reliability and Compliance

Key Takeaways

  • Simulation-first testing catches hidden control and protection issues before they reach the field, which protects uptime and shortens schedules.
  • Real-time platforms provide auditable evidence for grid code compliance, so approvals rely on measured behavior instead of assumptions.
  • Electromagnetic transient studies reveal inverter interactions in weak grids and fast transients, guiding settings that keep assets online through faults.
  • Hardware-in-the-loop fuses software models with physical devices, producing confidence that the integrated system performs as intended.
  • Treating simulation as a daily practice turns commissioning into confirmation, not discovery, which improves reliability and project predictability.

You cannot trust any new inverter or control scheme on the grid until it has proven itself in a high-fidelity simulation first. Modern electric grids have become so complex and software-driven that traditional testing methods are struggling to keep up. Operators face a delicate balancing act, integrating fast-acting renewable energy systems while meeting strict grid code requirements meant to maintain stability.

Relying on outdated planning studies or minimal field tests often leaves dangerous blind spots. In fact, regulators have warned that doing only the bare minimum can leave the grid vulnerable, potentially losing critical resources during disturbances. We believe a simulation-first approach is now essential to bridge innovation with assurance. It is the only way to catch hidden issues early and deliver upgrades that improve reliability and meet every compliance standard.

Traditional testing fails to ensure reliability in today’s complex grid

Legacy planning tools and one-off field tests cannot fully predict how today’s grid innovations will behave under stress. Many of the newest inverter-based resources operate on control timescales measured in microseconds, far faster than the phenomena captured by traditional transient stability studies. Conventional simulations assume idealized conditions and slower dynamics, so they miss the high-frequency switching effects and control interactions that occur when solar farms and battery systems respond to grid events. As a result, issues like oscillations, unexpected trips, or harmonics can slip through design reviews unnoticed.

The consequences are being felt during commissioning and live operation. Engineers are often surprised by sudden inverter shutdowns or protection mis-coordination when new equipment is first energized on the grid. In one recent analysis, nearly 27% of utility-scale solar plants were found to be running with non-compliant fault ride-through settings. This is precisely the kind of hidden flaw that simplistic tests failed to catch. Last-minute fixes to such problems can derail project timelines, and worse, they undermine grid reliability by leaving the system prone to unnecessary outages. Without a more rigorous pre-deployment test environment, teams have no safe way to validate new devices and control schemes against worst-case scenarios before public service, creating a risky gap between innovation and dependable operation.

Real-time simulation offers a safer path to grid reliability and compliance

A real-time simulation environment gives engineers a controlled, risk-free playground to prove out their designs. Instead of hoping that a new control or device will work as intended, teams can stress-test it exhaustively in a digital twin of the grid. Key advantages of this simulation-first approach include

  • Extreme scenario testing: Engineers can recreate rare but dangerous grid events (such as multi-phase faults, sudden loss of generation, or surges from lightning strikes) without any danger to actual customers or equipment. Even the most severe transients can be introduced in the simulator to see how a design holds up, all with zero risk of causing an outage.
  • Early flaw detection: High-fidelity models reveal instabilities and control bugs that would have gone unnoticed in cursory tests. Developers catch oscillations, timing errors, and misconfigured settings during simulation so that these issues can be fixed long before installation. This means no more unpleasant surprises during commissioning.
  • Grid code compliance validation: Detailed simulator outputs help confirm new systems meet stringent standards. For example, an inverter’s low-voltage ride-through behavior can be verified against regulatory requirements by observing its full waveform response. The recorded waveforms and performance metrics provide traceable proof that interconnection rules are satisfied.
  • Faster project cycles: Real-time simulation significantly accelerates testing and iteration. Tuning a control algorithm against a live digital grid reduces validation time from months to days. Utilities can evaluate multiple scenarios back-to-back in software, compressing what used to be weeks of trial-and-error into a much shorter development loop.
  • Hardware-in-the-loop realism: Simulation platforms can integrate physical hardware (such as actual inverter controllers or protection relays) directly into the test environment. This means the real devices “think” they are connected to a live grid, letting teams verify that the hardware and software work together under all conditions. Any device that passes tests in the loop is essentially pre-approved for field deployment.

With this kind of rigorous trial run, new grid components come online with far greater confidence. Teams can embrace innovative solutions like renewables or advanced controls, knowing they have already been proven in a virtual power network. In fact, electromagnetic transient (EMT) simulation has become the go-to technique for vetting renewable integration before it ever touches the actual grid.

“You cannot trust any new inverter or control scheme on the grid until it has proven itself in a high-fidelity simulation first.”

EMT simulation validates renewable integration under real conditions

Electromagnetic transient (EMT) simulation reproduces the detailed waveform-level behavior of power systems, which is crucial for testing renewable energy sources that interact with the grid in complex ways. This approach allows engineers to see exactly how solar, wind, and other inverter-based generators will perform in realistic grid scenarios.

Validating renewables in weak grid conditions

Renewable plants are often connected in areas with limited grid strength, where low short-circuit levels and minimal spinning inertia make stability a challenge. EMT simulation enables precise modeling of these “weak grid” conditions so that engineers can fine-tune control settings and verify stability margins. For instance, a wind farm’s control system can be tested against severe voltage dips and frequency fluctuations to ensure it rides through faults instead of tripping offline. Through experiments in the simulator, developers can adjust inverter parameters (like phase-locked loop tuning or current injection logic) to optimize performance before the project ever faces a real grid disturbance. The result is confidence that even in a weak grid, the new renewable asset will comply with grid codes and maintain reliability.

Capturing fast solar and wind transients

Solar and wind outputs can change at a speed that pushes grid equipment to its limits. A passing cloud can cause a utility-scale solar farm’s output to swing by tens of percent within a minute, causing voltage swings that traditional models might gloss over. Real-time EMT simulation captures these rapid transients. In fact, solar farms can ramp at rates of around 30% per minute under certain conditions, and simulation tools allow operators to inject those sudden irradiance changes into their virtual grid to see how voltage regulators, inverters, and energy storage react. Likewise, abrupt wind gusts or turbine switching events are faithfully represented in an EMT model, revealing any flicker, harmonic distortion, or control oscillations that need mitigation. This level of detail ensures that renewable installations are robust against the fast fluctuations characteristic of nature.

Meeting interconnection requirements with simulation evidence

Every new wind or solar project must meet stringent interconnection requirements. These include fault ride-through capability, voltage support, frequency response, and proper protection coordination. EMT simulation provides a way to demonstrate these capabilities before field commissioning. Engineers can run official grid code compliance tests virtually, recording how an inverter responds to mandated test events (like low-voltage ride-through sequences or frequency drops) and then provide those waveforms as proof to regulators. In fact, many grid operators now insist on seeing EMT-based studies as part of the interconnection approval process. This high-fidelity approach smooths the path to regulatory compliance and greatly reduces the risk of late-stage design changes.

Real-time simulation is now indispensable for ensuring grid reliability and compliance

“A real-time simulation environment gives engineers a controlled, risk-free playground to prove out their designs.”

In modern grid operations, real-time simulation has shifted from a luxury to an absolute necessity. It is the linchpin that allows utilities to innovate with new technologies while still keeping the lights on and every regulation satisfied. When high-fidelity simulation is built into the core of planning and testing, engineers can deploy upgrades faster, avoid unforeseen outages, and document full compliance at every step. In short, projects no longer need to “hope for the best”; they have concrete proof of stability before equipment ever goes live.

This simulation-first mindset ultimately leads to a more resilient and adaptive power network. Grid operators can embrace ambitious renewable integrations and advanced control schemes without fear of unintended consequences, because every scenario has been vetted in advance. As power systems become more software-defined and dynamic, real-time simulation stands out as the bridge connecting bold innovation with unshakable reliability. By treating rigorous simulation as non-negotiable, the industry is ensuring that reliability and compliance remain uncompromised even as the grid undergoes rapid change.

OPAL-RT perspective on simulation-driven grid reliability

Building on the imperative for simulation-first practices, OPAL-RT has been a pioneer in making high-fidelity real-time simulation accessible to power engineers. For over two decades, the company has focused on open, high-performance platforms that allow users to recreate precise grid conditions in the lab, ranging from microsecond transients to multi-megawatt network events. We work hand-in-hand with utilities, manufacturers, and research institutions to ensure that every new control strategy or piece of equipment can be rigorously proven before deployment. In doing so, our technology directly addresses the pain points faced by modern grid teams. It provides a safe sandbox for extreme scenario testing, catches design flaws early, and delivers detailed evidence for compliance audits.

This commitment to a simulation-first point of view comes from practical experience. Time and again, we have seen that when a system passes our hardware-in-the-loop tests, it performs reliably on the live grid. That is why we design our solutions to integrate seamlessly into development cycles, so simulation isn’t an afterthought but a continuous support from concept to commissioning. By empowering engineers to experiment freely and validate thoroughly, we are helping drive a new era of grid innovation that never compromises on reliability or regulatory standards.

Compliance standards for the grid are exacting. They require proof that equipment and control systems will behave within specified limits during all kinds of disturbances. Real-time simulation provides a way to test against those standards in a controlled environment. Through simulation of faults, frequency drops, and other grid events, engineers can verify that a new device (like an inverter or relay) stays within mandated performance criteria. The results give utilities confidence and documentation that they meet grid codes before connecting new assets.

Electromagnetic transient (EMT) simulation is used by operators to model renewable energy sources with very high detail. For example, a utility can create an EMT model of a new solar farm or wind plant and then subject it to scenarios like rapid output fluctuations or grid faults. The EMT simulator shows exactly how the renewable plant’s inverters and controls respond in those scenarios. Operators use this insight to ensure the plant won’t cause instability – they can adjust control settings or add equipment (such as STATCOMs or storage) in the model until the renewable integration performs reliably. Essentially, EMT simulation lets them iron out any issues with a renewable project on a digital grid before it goes live.

Hardware-in-the-loop (HIL) testing means putting a real physical device into a simulated grid loop to see how it behaves. In power systems, this often involves connecting actual hardware – like a protection relay, controller, or even a solar inverter – to a real-time digital simulator. The simulator behaves like the power grid, feeding the device voltages and currents as if it were on a live system. This way, engineers can observe the hardware’s response to faults, fluctuations, and control signals in real time. HIL testing combines the best of both worlds: you get to test genuine equipment under myriad conditions safely, without any risk to the actual grid.

Traditional grid studies (such as off-line load flow and transient stability simulations) simplify many electrical details and often run slower than real time. Real-time simulation, on the other hand, models the grid with much finer time steps and can execute the simulation in sync with “wall clock” time. This means it can capture fast transients and control interactions that might be missed in conventional studies. Additionally, real-time simulators can interface with physical hardware or control systems directly. In short, traditional studies are great for long-term stability and planning analysis, but real-time simulation provides a closer, more dynamic replication of grid behaviour for testing and validation purposes.

Engineers discussing SimPowerSystems simulation workflows in an office meeting.
Power Systems, Simulation

Why Electrical & Power System Simulation is Critical in Engineering

Engineers can no longer design today’s complex power systems safely without advanced simulation. Modern electrical grids are complicated, integrating renewable energy and distributed generation. This soaring complexity introduces countless potential failure modes as cumulative distributed energy resource (DER) capacity in the U.S. will reach 387 GW by 2025, multiplying the elements engineers must manage. Development cycles are tighter than ever and reliability standards unforgiving, making it impractical and risky to test new designs directly on live power infrastructure. Real-time simulation offers a powerful alternative: it provides a safe, high-fidelity virtual environment to validate and refine power system designs, catching issues early, accelerating development, and ensuring systems will perform reliably – all without costly physical prototypes or dangerous in-field experiments. Simulation bridges the gap between concept and operation, enabling engineers to innovate swiftly despite rising complexity.

Complex power systems require simulation for safe testing

Electrical power systems have grown far too intricate to rely on trial-and-error field testing. A single grid involves thousands of components, any of which can behave unexpectedly. Physically testing extreme scenarios on the real grid or a prototype is not only expensive but potentially catastrophic. A misstep can cascade into equipment damage or widespread outages, and we know major power interruptions carry enormous economic costs. U.S. businesses lose around $150 billion annually due to outages. Simulation, by contrast, lets engineers safely recreate these scenarios in a controlled digital setting.

Using detailed power system models, an engineer can impose severe faults, rapid load fluctuations, or unusual configurations virtually, all without endangering real equipment or customers. High-fidelity simulators replicate electrical behavior down to microsecond transients, so even fast-acting phenomena like inverter trips or protection-system responses can be observed closely. This means you can explore worst-case events (a cascading line failure, a sudden surge of solar generation, etc.) and see how the system holds up long before any physical implementation. Such safe virtual testing reveals vulnerabilities early and prevents costly surprises later. As power systems become more complex and less forgiving, simulation has become the only practical way to test new designs and control strategies without putting people or infrastructure at risk.

Real-time simulation offers a powerful alternative: it provides a safe, high-fidelity virtual environment to validate and refine power system designs, catching issues early, accelerating development, and ensuring systems will perform reliably.

Simulation accelerates design and reduces failure risk

Engineering teams are under pressure to deliver better power system solutions on tighter schedules. Traditional build-and-test cycles – constructing prototypes, waiting for field tests, iterating after failures – are simply too slow and risky today. Simulation fundamentally changes this equation by allowing much faster, iterative development. You can model a new grid control algorithm or substation design and start testing it virtually within hours, not months, quickly refining the design without waiting for hardware. This accelerated design loop gets innovations to market faster and slashes development costs. Notably, one power plant project that leveraged high-fidelity simulator training saw a 15% reductionin commissioning time, illustrating how virtual testing streamlines deployment.

Simulation also helps you find and fix problems when they’re easiest (and cheapest) to solve. Catching a design flaw early can save tremendous hassle – an error found in operation can cost hundreds of times more to fix than one caught at the design stage. Real-time simulation makes this early discovery possible: engineers can subject control software or equipment models to thousands of scenarios (faults, load spikes, component failures) in the virtual world and identify weaknesses well before anything goes live. By the time you move to physical prototyping, you’re dealing with a far more mature and proven design. 

This dramatically reduces failure risk during development and after deployment. Instead of learning from costly mistakes in the field, your team learns safely from simulations. The result is a faster design cycle with fewer iterations wasted on rework, and far greater confidence that once the system is built for real, it will work as intended from day one.

  • Early virtual prototyping: Simulation lets you test conceptual designs and control strategies immediately, so you can iterate without waiting for physical prototypes.
  • Rapid scenario testing: Automated simulations can run hundreds of scenarios (grid disturbances or equipment outages) overnight. Engineers get instant feedback and can refine designs in days instead of months.
  • Safe failure exploration: You can push systems to the brink in simulation – creating rare faults or extreme overloads – without real-world consequences. This uncovers edge-case failures that traditional testing might miss while keeping hardware safe.
  • Fewer physical prototypes: By validating ideas in software first, teams often build far fewer hardware prototypes. Expensive testing is reserved only for final, well-vetted designs, cutting costs and development time.
  • Collaborative design: Simulation provides a shared sandbox where electrical engineers, control developers, and protection experts can experiment together. Issues at component interfaces are caught early, before they become costly integration problems.

With these advantages, real-time simulation has become a catalyst for both speed and quality in power engineering. It empowers your team to move fast but safely. Engineers can try bold ideas in a risk-free digital environment, refine them quickly, and avoid the nightmare of late-stage failures. Simply put, simulation-based workflows produce better designs in a fraction of the time of traditional methods.

High-fidelity simulation bolsters reliability and performance

Once a power system moves from design into operation, there’s zero room for error thus reliability and efficiency must be assured. High-fidelity simulation plays a critical role in meeting these goals. Because real-time simulators can model electrical behavior with extreme precision, engineers can fine-tune systems for maximum stability, efficiency, and robustness. Advanced electromagnetic transient (EMT) simulations let utilities study how inverter-based resources respond to grid faults in far greater detail than traditional models. The North American Electric Reliability Corporation (NERC) has even warned that these detailed simulations are necessary to identify and mitigate emerging reliability risks on modern grids. Engineers use high-fidelity models to verify that protective devices and controls react correctly to disturbances. Every subtle dynamic can be validated, giving operators confidence that the real system will perform as expected.

Ensuring system reliability

Real-time simulation allows engineers to apply countless “what-if” disturbances and verify the grid remains stable. They can simulate generator trips, short-circuits, or other faults and see how the system reacts, exposing and fixing weak links long before any real event. By the time a design is deployed, it has been proven through thousands of virtual trials which dramatically reduces the chance of unexpected outages.

Real-time simulation is now an engineering essential

The trajectory of power engineering has made real-time simulation indispensable. Faced with soaring grid complexity and uncompromising reliability demands, engineers worldwide have integrated simulation into every stage of development. In fact, leading researchers caution that without state-of-the-art simulation tools, utilities may struggle to maintain reliability as the grid undergoes change. High-fidelity, real-time models are no longer a luxury as they are central to how we design resilient systems today. Utilities and manufacturers now use real-time digital twins to validate designs before construction, knowing that every critical component should be vetted virtually. This approach has proven so effective it’s becoming standard across other high-stakes industries. Real-time simulation is the new benchmark for de-risking complex engineering projects.

High-fidelity simulators replicate electrical behaviour down to microsecond transients, so even fast-acting phenomena like inverter trips or protection-system responses can be observed closely.

The rise of real-time simulation doesn’t replace human ingenuity, so when every hypothetical scenario can be explored on a simulator, design teams gain a deeper understanding of system behavior and better decisions. And when projects go live, stakeholders have peace of mind knowing the system has already been through the digital wringer. Real-time simulation has become an engineering essential by bridging the gap between theory and practice. It allows us to tackle power system challenges swiftly and safely, delivering resilient, high-performance designs on tight timelines.

OPAL-RT empowering engineers with real-time simulation

Building on the understanding that real-time simulation is essential in modern power engineering, OPAL-RT has long focused on equipping engineers to meet these complex challenges. The company provides real-time simulation platforms that allow teams to model and test everything from individual power electronics devices to entire power grids with uncompromising fidelity. By using its Hardware-in-the-Loop and digital twin solutions, engineers can safely validate control strategies and equipment designs against all the scenarios – multi-source grids, fast transients, fault conditions – long before construction. This means you catch design issues early, refine system performance, and confidently achieve reliability targets without slowing development.

This approach aligns with the pain points and benefits outlined above. Its real-time simulators and software tools empower organizations to handle soaring system complexity on tight schedules while maintaining the highest standards of safety and reliability. Across the energy sector and beyond, the company is a trusted partner for innovators seeking to bridge the gap between concept and operation. From utilities adding renewables to R&D teams developing new converters, engineers can lean on this real-time simulation expertise to accelerate their progress. The result is not just faster design cycles, but more resilient power systems ready to meet real demands – which is why power system simulation has become critical in engineering

Electrical simulation lets you test extreme conditions without risking equipment or infrastructure. Instead of exposing assets to destructive scenarios, you can study performance in a controlled digital environment. This gives you confidence that your system can withstand faults and stresses. OPAL-RT provides simulation tools that help you reach this level of safe validation with accuracy and speed.

Simulation software helps you shorten design cycles while lowering costs by catching design flaws early. You can model grid behaviour, validate controls, and fine-tune settings before moving to hardware. This avoids wasted time and rework, ensuring smoother implementation. OPAL-RT supports these workflows with high-performance simulators designed to help you deliver reliable outcomes faster.

High-fidelity models capture system behaviour down to microsecond details, allowing engineers to validate protective responses and stability. Without this precision, hidden risks could pass unnoticed until operation. Using accurate simulations gives you confidence that your systems will perform as expected. OPAL-RT specializes in real-time platforms that bring this level of fidelity to your projects.

Renewables add variability and complexity to power grids that traditional testing cannot fully cover. Real-time simulation lets you model inverter dynamics, rapid output shifts, and grid interactions in detail. This ensures you can design controls that keep systems stable under changing input. OPAL-RT helps renewable project teams use real-time testing to accelerate integration and maintain reliability.

OPAL-RT provides real-time simulation platforms that engineers use to validate concepts and reduce development risk. These tools let you refine designs virtually and be confident before building prototypes. The result is faster project timelines and higher assurance of success. Engineers across energy and academic sectors trust OPAL-RT to support their most complex validation needs.

Engineer assembling real-time simulation hardware for SimPowerSystems testing in a technology lab.
Industry Application, Simulation

Differences & Applications Between Electrical Modeling vs  Simulation Software

Great testing starts when your models and simulations tell the same story. Missed physics, hidden latencies, or solver limits can mislead your design choices. Teams that separate description from execution spot risks earlier and cut lab time. That is why understanding modelling tools and simulation engines matters to every power project.

Power engineers, hardware-in-the-loop (HIL) testers, and researchers face the same tension. You need rich models to capture control intent, and you need fast simulation to exercise edge cases. Tool selection shapes requirements flow, lab architecture, and test coverage. The right mix gives you speed, confidence, and room for future changes.

Why engineers compare electrical modeling and simulation tools

Power projects rarely fail because a single component looked wrong; they fail because interactions were misunderstood. Comparing modelling suites and simulation engines helps you decide how to represent those interactions with the fidelity your team can maintain. Modelling focuses on structure, parameters, and control intent so that everyone shares the same electrical story. Simulation focuses on numerical behaviour across time so that you can probe stress, stability, and safety. You compare tools to balance model readability, solver performance, reproducibility, and lab integration.

Budget and schedule also force tradeoffs that are easier to manage with the right pairing. High-fidelity models with slow solvers stall project gates, while fast solvers with incomplete models hide integration risk. Comparing toolchains early keeps measurement, automation, and version control aligned across design, software, and testing. That alignment limits rework, clarifies ownership, and shortens the path from concept to field trials.

What electrical modeling software does for power system design

Electrical modeling software helps you capture design intent as consistent, shareable representations of your system. It lets teams encode schematics, control logic, and ratings as data their simulators can execute. Good models separate parameters from structure, which improves reuse, reviews, and change tracking. Clear models shorten onboarding for new teammates and make subsequent simulation runs meaningful.

Topology capture and parameter management

Modelling tools help you define buses, branches, converters, and sensors without jumping into solver settings. You assign ratings, impedances, delays, and limits as parameters that can be versioned and reviewed. Named parameters feed bill-of-materials estimates, protection studies, and controller targets. Structured topology also makes it easier to maintain variants for different power levels, grid codes, and suppliers.

Parameter sets let you switch between rated, cold-start, and faulted conditions without redrawing the circuit. Templates reduce copy‑paste errors, improve consistency, and speed up peer review. When models track units and ranges, you catch mismatches early, before those numbers reach the lab. That discipline improves traceability from requirements to simulation cases and hardware settings.

Control design scaffolding

Control engineers need a place to express state machines, PWM strategies, and observers alongside the plant. Modelling suites let you partition plant and control while keeping signal names, timing, and interfaces consistent. You can lock interfaces, share test vectors, and keep clear change logs between control and plant teams. This scaffolding shortens handoff to firmware, reduces ambiguity, and increases reuse across projects.

When the model already reflects quantization, saturations, and delays, later simulation behaves more like the bench. Control gains can be tied to parameter sets, which supports sweep studies and autotuning workflows. Clear structure also allows formal reviews, static checks, and lightweight unit tests of control pieces. Those practices reduce integration issues and improve safety margins during field trials.

Physics-based component libraries

Component libraries give you validated blocks for machines, converters, lines, and protective elements. Good libraries document reference equations, assumptions, and applicable operating ranges. When those details are present, reviewers can judge fitness for use and predict limits. Shared libraries also keep multi‑team projects consistent, since everyone pulls from the same sources.

Library quality matters because subtle modelling choices change controller robustness and loss estimates. For example, saturation and hysteresis treatment in machines can affect current ripple and torque prediction. Clear options for ideal, average, and switching models let you trade speed for fidelity as needed. Documentation that cites validation data builds the trust you need for later certification steps.

Interoperability with design toolchains

Modelling is more useful when portable across toolchains, code bases, and labs. Support for Functional Mock-up Interface (FMI) and Functional Mock-up Unit (FMU) formats lets teams exchange models without rewriting code. Clear import and export options cut time spent on glue code between analysis tools, automation scripts, and test equipment. Interoperability also helps with vendor audits, since reviewers can execute models in their preferred tools.

Version control hooks and diff‑aware formats simplify change review and traceability. Structured data makes parameter sweeps reproducible, which benefits certification and internal quality checks. Shared model repositories reduce duplicated effort across teams, sites, and partners. The result is a smaller set of models that serve more use cases, with fewer surprises.

Electrical modeling software should make structure explicit, standardize parameters, and clarify control interfaces. Strong modelling practices set the baseline for every later experiment. Teams that invest here enjoy faster reviews, cleaner handoffs, and fewer late fixes. That foundation makes subsequent simulation runs faster to set up, easier to audit, and more predictive.

Great testing starts when your models and simulations tell the same story.

How electrical simulation software improves testing and validation

Simulation converts your static models into time‑domain behaviour you can interrogate before you touch hardware. Electrical engineering simulation software brings solvers, schedulers, and tooling that mirror conditions you care about. Good simulation helps you surface edge cases, size components, and prepare protection settings. It also makes lab sessions more productive, since you arrive with known risks, extracts, and scripts.

Scenario exploration and edge cases

Simulation lets you vary topology, loads, and operating points without touching the lab bench. You can sweep temperature, aging factors, and sensor errors to see how margins shift. Event scheduling allows precise sequencing of faults, reclosers, and controller failovers. Those sequences reveal interactions that are hard to stage physically, such as rare overlaps of delays and thresholds.

Monte Carlo runs expose combinations that manual testing misses, while keeping seed control for reproducibility. Parameter sweeps generate response surfaces that guide sizing choices for inductors, capacitors, and heat sinks. Time compression lets you preview slow processes like thermal drift and state of charge. Records from these runs become living documentation for safety reviews, field support, and future upgrades.

Closed-loop tests with HIL

Hardware-in-the-loop (HIL) connects the simulator to your controller so that code sees realistic signals. Low latency digital input and output, plus accurate timing, makes switching behaviour and protection logic meaningful. Plant models can run at fixed steps or real time, depending on scheduling and available compute. You can stage faults, dropped packets, and sensor failures while keeping hardware safe.

Software-in-the-loop (SIL) and model-in-the-loop (MIL) complete the chain before HIL, which reduces risk at each stage. Field programmable gate array (FPGA) support brings microsecond timing that suits power electronics, motor control, and grid studies. Power hardware-in-the-loop (PHIL) adds actual power flow for converter testing, with careful management of stability and ratings. Closed‑loop practice yields better tuned controllers, safer startups, and shorter trips to the field.

Faster iteration with compiled solvers

Compiled solvers accelerate long runs so you can evaluate more scenarios within a fixed test window. Switching models that support average mode let you trade waveform detail for cycle‑accurate dynamics. Adaptive step logic focuses effort where transitions occur, which saves compute while preserving key effects. Batch execution with parallel workers turns nightly runs into next‑day plots and metrics.

Careful solver selection also avoids the numerical artefacts that sometimes appear with stiff systems. You can keep frequencies of interest in band, and still finish runs within practical time limits. Clear reporting on solver settings makes those results defensible during peer review. This pace of iteration improves confidence when projects hit gate reviews, audits, and design freezes.

Regression and compliance validation

Simulation suites track scenarios as test cases, complete with pass and fail criteria. You can script waveform checks, limit violations, and settling times so that results are repeatable. Those checks align with standard ranges and customer targets, which saves time later. Versioned scenarios also help during supplier changes, since you can re‑run the same tests and compare metrics.

When the lab turns up a corner case, the scenario can be reproduced in simulation and then widened. That loop shortens mean time to fix, improves traceability, and teaches the team which margins matter most. Compliance bodies appreciate documented evidence that links requirements to traces, tables, and scripts. Regression suites prevent silent drift, especially when multiple teams contribute to the same code base.

Simulation pays off when it shrinks uncertainty before you book lab time. Electrical engineering simulation software should expose edge cases, support closed‑loop testing, and scale across solvers. A thoughtful setup gives you repeatable results that hold up in design reviews and safety audits. That discipline turns models into evidence you can trust in production decisions.

Key differences between electrical modeling and simulation software

The main difference between electrical modeling software and simulation software is that modelling defines the system’s structure and parameters, while simulation executes those definitions over time to predict behaviour.

Modelling captures topology, control intent, and constraints as a portable description. Simulation brings numerical methods, scheduling, and data capture that turn that description into waveforms and metrics. Treating them as distinct reduces confusion when teams discuss accuracy, performance, and ownership.

Most projects use both, often within the same suite, but the roles still differ. Clarity about the handoff keeps parameters in one source of truth, and keeps solver settings tied to test plans. The table below summarizes contrasts that frequently matter during tool selection and process reviews. Use it to align expectations across modelling leads, test engineers, and reviewers.

AspectModelling softwareSimulation softwareValue to teams
Primary purposeDescribe structure, parameters, and control intentExecute models over time to produce waveforms and metricsKeeps responsibilities clear and reduces disputes over results
Typical usersSystem architects, control engineers, reviewersTest engineers, analysts, automation staffImproves collaboration and handoffs
OutputsSchematics, parameter sets, interface definitionsTime traces, logs, statistics, limitsLinks design to measurable outcomes
Time baseStatic or configuration‑orientedDiscrete time, continuous time, or mixedMatches solver to the physics of interest
Performance focusMaintainability, reuse, claritySpeed, numerical stability, throughputBalances readability with compute efficiency
Integration pointsRequirements, version control, documentationHIL rigs, data stores, reporting toolsSupports both governance and testing
Risks from misuseOut‑of‑date parameters, unclear interfacesMisleading results from wrong solver settingsGuides reviews to catch the right issues

Applications of electrical power system analysis software in engineering projects

Electrical power system analysis software ties models and simulation to actionable engineering studies. Engineers use it to calculate flows, stress, and stability across operating points and events. Clear studies guide settings, hardware selection, and safety reviews for projects of many sizes. These applications show how analysis tools cut risk, shorten lab time, and inform commissioning.

Microgrid planning and protection studies

Projects that mix generation, storage, and loads need steady‑state and transient checks. Power flow, short circuit, and protection coordination studies come from the same data model when set up well. Voltage regulation and islanding require attention to limits, droop settings, and reserves. Analysis tools help teams define operating modes, ride‑through settings, and safe reconnection paths.

Disturbance cases reveal how converters share current during faults, and how relays see events. Renewable variability affects state of charge and feeder voltage, so studies include profiles and contingencies. Detailed models of inverters, filters, and lines make protection settings both selective and robust. The outputs inform controller tuning, feeder hardware choices, and operator playbooks.

Vehicle powertrain and energy storage

Traction systems involve converters, machines, and batteries with tight timing and thermal limits. Analysis runs sweep drive cycles to estimate losses, temperatures, and lifetime effects. Fault cases test isolation, contactor sequences, and limp‑home strategies that protect occupants and assets. Battery models track ageing, state of charge, and impedance, which shapes performance and warranty.

Motor control strategies are assessed for stability, noise, and efficiency across speed and load. Hardware sizing depends on cooling assumptions, packaging, and expected duty cycles. Control and plant teams share a single model, so firmware changes reflect into energy and thermal projections. That link keeps program risks visible and supports sign‑off across engineering, quality, and safety.

Aerospace power distribution and redundancy

Aircraft power systems prioritize weight, fault tolerance, and clear isolation during abnormal events. Analysis software evaluates bus transfer logic, load shedding, and generator limits under multiple failures. Transient cases examine arc risks, contactor timing, and converter overshoot. Studies also assess electromagnetic compatibility ranges that affect sensors and communication.

Redundancy planning includes alternate feeds, hot spares, and preferred fault clearing paths. Thermal and altitude effects are represented so that ratings reflect actual service conditions. Results feed system safety assessments, including failure modes and effects. This rigour supports certification evidence and gives project leads defensible margins.

Academic teaching and research labs

Education benefits when students see models, waveforms, and hardware react to the same scenario. Analysis software linked to HIL allows safe exposure to faults, controller mistakes, and corrective strategies. Open interfaces and standards help labs pair new algorithms with existing rigs. Repeatable studies make grading easier, and promote careful lab practices.

Researchers need flexible workflows that move from simulation to small‑scale rigs without uprooting models. A single source of parameters keeps papers and lab results aligned. Scripted studies let students compare control strategies using consistent metrics and plots. These habits carry into industry projects, where clarity and repeatability are valued.

Power studies work best when they reuse the same models that drive simulation and HIL. Electrical power system analysis software should organize data so that planners, control teams, and testers share context. Teams gain quicker sign‑off, clearer safety cases, and fewer late surprises. That consistency keeps design, testing, and commissioning aligned from first sketch to final acceptance.

Choosing the right electrical system design software for your project goals

Tool selection affects speed, traceability, and budget from day one. Electrical system design software must suit your solver needs, model structure, and lab plans. Clarity on constraints saves time later, especially when audits and certification arrive. Use these criteria to focus on fit, not hype or convenience.

  • Modelling fidelity you can maintain: Pick the highest fidelity you can validate and keep current. Consistency beats complexity that no one can review.
  • Solver performance where it counts: Match step sizes and latency to your control bandwidths and switching speeds. Confirm with trial cases that run times fit your schedule.
  • Closed‑loop testing support: Confirm I/O timing, jitter, and range for HIL, SIL, and MIL workflows. Look for tools that make it easy to script scenarios and log data.
  • Interoperability and standards: Favour FMI and FMU exchange, open file formats, and straightforward APIs. That choice reduces glue code and protects your process from tool lock‑in.
  • Governance and traceability: Ensure requirements, parameters, and results live in systems that support reviews. Look for readable diffs, change logs, and signed baselines.
  • Usability for your team: Prioritize features your engineers will use daily, not rare corner features. Short learning curves and clear diagnostics keep productivity high.
  • Support and roadmap you trust: Choose a vendor that answers technical questions with substance, and listens to feedback. Ask for release notes, long‑term support options, and example projects that match your domain.

Fit beats feature count when teams face schedules, gates, and audits. Map priorities to your risks, then confirm through trials that the tool meets them. When Electrical system design software aligns with process, results arrive sooner and with fewer surprises. That approach reduces stress on people, preserves budgets, and leaves room for growth.

Benefits of integrating electrical circuit simulation software into development workflows

Integrated workflows reduce friction between design, firmware, and test roles. Electrical circuit simulation software connected to your repositories and rigs turns lab time into planned experiments. Shared scenarios, parameter sets, and scripts travel from desktop to HIL without rework. That continuity improves reproducibility, saves setup time, and protects team focus.

Data captured from simulation and HIL produces comparable metrics that management can review quickly. Automated checks catch regressions early, and keep quality records tidy for audits. Engineers spend less time moving files, and more time improving controls, protections, and safety. The payoff shows up as cleaner releases, fewer urgent fixes, and calmer commissioning.

How OPAL-RT helps engineers build confidence in electrical system testing

OPAL-RT builds real-time digital simulators that run detailed plant models with microsecond timing. You can drive controllers through analogue and digital I/O, or connect over common protocols for networked tests. Open interfaces support model exchange standards and common scripting approaches, so teams keep their tools. Scalable platforms let you move from model-in-the-loop to HIL and power stages without rewriting models. Teams count on low latency I/O, clear timing control, and reliable execution to make tests repeatable.

For power system studies, OPAL-RT supports phasor, electromagnetic transient, and electric machine models that match the fidelity you need. Engineers can stage faults, replay captured field waveforms, and script acceptance checks that match standards. Integration with lab equipment keeps capstone tests safe, traceable, and affordable. Support staff with deep simulation expertise stay available to help troubleshoot models, iterate setups, and interpret results. That combination gives leaders confidence that each test stands up to scrutiny.

FAQ

You want tools that match the physics you care about, the solvers you can trust, and the reports your reviewers expect. Look for clear model structure, reproducible cases, and support for standards like Functional Mock-up Interface (FMI) and Functional Mock-up Unit (FMU). Prioritise timing, latency, and data logging that suit protection, control, and safety checks. OPAL-RT helps you assess fit with real-time execution and closed-loop testing so your team gains confidence faster.

Modelling captures topology, parameters, and control intent as a consistent description you can review and version. Simulation executes that description across time to produce waveforms, limits, and metrics you can compare and sign off. Treating them separately keeps ownership clear, improves traceability, and speeds audits. OPAL-RT supports both roles with open interfaces, real-time performance, and scalable rigs that keep results actionable.

Use average and switching models where they make sense, then validate with Hardware-in-the-Loop (HIL) at the correct time steps. Run batch sweeps and scripted pass or fail checks to focus bench hours on high-value cases. Keep parameters in one source of truth so simulation, software-in-the-loop, and HIL share identical scenarios. OPAL-RT streamlines that flow so your lab sessions start with known risks, cleaner data, and tighter timelines.

Define versioned scenarios with limits, settling times, and event sequences that mirror standards and project targets. Capture solver settings, seeds, and parameter sets so results are repeatable across teams and suppliers. Export plots and structured logs that reviewers can compare without guesswork. OPAL-RT helps you stage faults, replay traces, and script checks so evidence holds up during reviews.

Yes, provided models, parameters, and scenarios move cleanly from desktop to HIL without rewrites. Instructors and junior engineers benefit from the same structure that senior testers need for audits and commissioning. Shared libraries and FMU exchange let you reuse work across labs, prototypes, and field support. OPAL-RT maintains that continuity with portable models, reliable timing, and support that focuses on outcomes, not just features.

1 2 3

Get started with SPS Software

Contact us
Privacy Settings
We use cookies to enhance your experience while using our website. If you are using our Services via a browser you can restrict, block or remove cookies through your web browser settings. We also use content and scripts from third parties that may use tracking technologies. You can selectively provide your consent below to allow such third party embeds. For complete information about the cookies we use, data we collect and how we process them, please check our Privacy Policy
Youtube
Consent to display content from - Youtube
Vimeo
Consent to display content from - Vimeo
Google Maps
Consent to display content from - Google
Spotify
Consent to display content from - Spotify
Sound Cloud
Consent to display content from - Sound
Cart Overview