

Key Takeaways
- Start solver selection from the study question, then match the method to the time scales and waveform detail the answer depends on.
- Treat time step, integrator choice, and tolerances as modelling parameters, since they directly control numerical damping, stability, and what features survive in the results.
- Build trust with disciplined validation, including consistent initial conditions, physical limit checks, and a short time step sensitivity run before interpreting converter or protection behaviour.
Choosing the right solver is how you get power system results you can trust.
Solver choice is not a software preference, it is a modelling choice that decides what physics your simulation can and cannot represent. A clean plot can still be wrong if the method cannot resolve the time scales that matter, or if numerical damping hides the behaviour you actually need to study. A standard lightning impulse used for insulation testing is 1.2/50 µs, and that single fact should settle one point early: some electrical questions live in microseconds, not seconds.
“Good solver selection starts with your study objective, then works backward to the model detail, the time step, and the numerical method that will hold accuracy where it counts.”
Speed matters, but it comes after correctness, because a faster wrong answer still costs you time when tests do not match, protections misoperate on paper, or controls look stable only because the solver blurred the dynamics. Treat the solver and its settings as part of your model, document them, and you will get results that hold up under review.
Define common power system solvers used in electrical studies

Power system solvers fall into a few families that each simplify the physics differently. Algebraic solvers handle steady state power flow and short circuit calculations without time stepping. Phasor and RMS time domain solvers step electromechanical dynamics using averaged network behaviour. EMT solvers step the full electrical waveforms, so switching, saturation, and fast protection effects show up directly.
Those families also differ in how they solve equations at each time step. Power flow typically uses Newton style iteration on algebraic equations, while EMT and RMS solvers integrate differential algebraic equations that combine network constraints with device dynamics. Fixed time step EMT focuses on repeatable waveform accuracy, while variable time step RMS often focuses on long runs with acceptable dynamic error. Solver terms like “explicit,” “implicit,” “trapezoidal,” and “backward Euler” describe how the integrator behaves when the system has fast and slow dynamics mixed together.
A practical way to keep this straight is to ask what your model states really represent. RMS and phasor models usually represent fundamental frequency magnitudes and angles, so they will not show PWM ripple or subcycle peaks that drive some protections. EMT models represent instantaneous voltages and currents, which is why they catch commutation overlap, diode recovery effects, and wave propagation effects when line detail matters. Once you pick the solver family, the rest of the setup is not “tuning,” it is matching the numerics to the physics you chose to represent.
Match study objectives to EMT and phasor domain simulation
EMT simulation is the right fit when the answer depends on waveform detail, fast switching, or subcycle interactions between the network and devices. Phasor and RMS simulation is the right fit when the answer depends on slower dynamics, steady state limits, or system level behaviour over many cycles. The method you choose sets a ceiling on the fastest phenomenon you can trust. That ceiling matters more than the run time.
A concrete way to choose is to frame your question as “what must be time resolved to answer this.” Consider a 13.8 kV industrial feeder with a VFD front end, a capacitor bank, and an overcurrent relay set near a sensitive process load. If you need to see capacitor inrush peaks, diode bridge commutation notches, and relay pickup on a distorted current, EMT will be the only method that shows those details without heavy assumptions. If you only need the post-event voltage recovery trend across tens of seconds after a motor restart, a phasor or RMS study will answer faster with less model detail.
| What you need to learn | Method that usually fits | What will decide accuracy most |
| Steady state voltages, losses, and equipment loading | Power flow with an algebraic network solver | Model data quality and consistent base values will matter more than solver settings |
| Generator angle and frequency response over seconds | Phasor or RMS electromechanical simulation | Machine, governor, and exciter models plus event timing will dominate results |
| Converter control interactions and switching related distortions | EMT time domain simulation | Time step, switch model detail, and control sampling will set what you can trust |
| Protection pickup that depends on subcycle peaks or distortion | EMT or waveform based protection modelling | Anti alias filtering, measurement windows, and integration method stability will matter |
| Long feeder voltage profiles across many load changes | Quasi static time series using steady state solves | Load models, tap logic, and event sequencing will dominate, not microsecond detail |
| Travelling waves and surge propagation along long conductors | EMT with distributed line representation | Propagation effects scale with the speed of light at 299,792,458 m/s, so time resolution must respect those delays |
Once the objective is clear, mixed workflows become easier to manage. Start with a simpler method to set initial conditions and sanity check operating points, then move to EMT only where the physics needs it. A solver does not fix missing model detail, and extra detail does not rescue a solver that cannot represent the behaviour your question depends on. Pick the method that matches the question, then set the numerics to protect that choice.
Use time step and integration settings to control accuracy
Time step and integration method control numerical error, numerical damping, and stability, so they directly shape what you will believe from a plot. A time step that is too large will smooth peaks and distort phase, even if the simulation “runs fine.” A method that is too aggressive on damping will hide oscillations that matter for control or protection. The right settings come from the fastest dynamics you must resolve, not from defaults.
Fixed step EMT usually works best when you set the step from switching frequency, the smallest L and C time constants, and the fastest control sampling in the model. A common engineering check is to keep enough points per switching period that switching edges do not collapse into one or two samples, then confirm key quantities do not change much if you halve the time step. Trapezoidal integration will preserve waveform detail well, but it can show numerical ringing if discontinuities are harsh. Backward Euler will damp high frequency content, which can help stability but can also hide the very ripple you needed to see.
- Set a maximum time step that is tied to your fastest physical time constant
- Check integrator choice against your need for ripple detail versus damping
- Align controller sample times with the simulation step to avoid timing drift
- Set nonlinear solver tolerances so currents and voltages converge tightly
- Re run a short window at a smaller step to confirm key results hold
Accuracy problems often look like “weird physics,” but the cause is numerical. Spikes at switching instants can be time step artefacts, while missing overshoot can be numerical damping. Event handling also matters, since breaker operations and limiter activations can create discontinuities that stress the integrator. When you treat the time step as a modelling parameter and not a performance knob, you will avoid long loops of trial and error.
Handle stiff networks and nonlinear devices without convergence issues
Stiff systems mix very fast and much slower dynamics, and that mix can cause explicit methods to become unstable or force impractically small steps. Nonlinear devices add iterative solves inside each step, so convergence settings become part of accuracy and not just a way to stop warnings. Ideal switches, saturating magnetics, and hard limits create discontinuities that make iterations struggle. Stable results come from a solver that matches stiffness and a model that avoids impossible idealizations.
Practical fixes usually start with the device models. Parasitic resistances, snubbers, and realistic source impedance remove infinite di or dv demands that no numerical method can satisfy. Smoother limiter functions often behave better than hard clipping, since they reduce sudden Jacobian changes during Newton iterations. Consistent initial conditions also matter, because a solver that starts far from a feasible operating point will waste iterations and can land in nonphysical states.
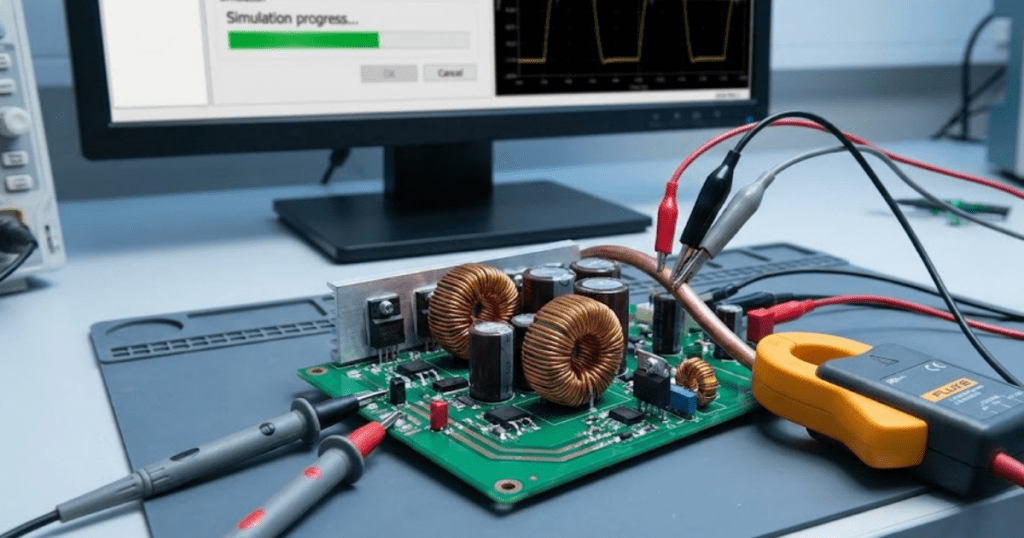
Tool transparency helps here because you can see what equation is actually failing when convergence breaks. SPS SOFTWARE is often used in teaching and research settings for this reason, since editable component models make it easier to spot where an “ideal” assumption created stiffness or where a limiter created an algebraic loop. Once the model is physically reasonable, implicit integration and sensible tolerances will do their job.
“Convergence success is not luck, it is the result of model realism and numerical alignment.”
Validate results using initial conditions, limits, and sanity checks

Validation is the step that proves your solver choice did not hide a modelling error. Initial conditions must match the steady state you intend, or the simulation will spend its first cycles correcting a mismatch you never meant to study. Physical limits must hold, such as capacitor voltage continuity and inductor current continuity across switching events. Basic sanity checks will catch unit errors, sign mistakes, and impossible setpoints before you trust any deeper insight.
Start with the simplest checks that do not require another tool. Confirm voltages and currents match expected magnitudes at steady state, confirm power balances are sensible, and confirm device states align with control logic. Check that protection elements see the same measurements you think you modelled, including any filtering and measurement windows. A short run with a reduced time step is also a strong check, because large differences signal numerical sensitivity that you must address before you interpret fine detail.
Limits and invariants provide another layer of confidence. Saturation should clip flux or current where the model says it should, not where the integrator can tolerate it. Energy stored in inductors and capacitors should not grow without a source, and damping should not appear from nowhere. When validation is disciplined, solver choice becomes a controlled engineering variable instead of a hidden source of uncertainty.
Avoid common solver selection mistakes in converters and protection studies
Most solver mistakes come from asking a waveform question with a non-waveform method, or from using an EMT method with settings that cannot resolve the behaviour you care about. Converter models amplify this problem because switching, control sampling, and nonlinear limits all sit close together in time. Protection models amplify it again because pickup and timing can depend on peaks, distortion, and measurement windows. You will get better outcomes when you treat solver settings as part of the protection or converter design, not as an afterthought.
Phasor studies often fail for converter and protection work when key triggers depend on distortion, DC offsets, or subcycle features. EMT studies fail when the time step is too large, when the integrator adds damping that hides ripple, or when ideal device models create discontinuities that force convergence shortcuts. Another common issue is mixing discrete logic with a variable time step without checking event timing, since timing drift can shift relay operations or control state changes. Clear alignment between sampling, switching, and integration timing keeps those errors from creeping in.
The best long term habit is to write down what must be resolved, then pick the simplest method that still resolves it cleanly. A short pilot run that checks convergence, time step sensitivity, and measurement behaviour will save more time than chasing “weird” plots late in a project. Teams that work in SPS SOFTWARE often formalize this as part of their model setup, since transparent equations and editable models make solver assumptions visible and reviewable. That discipline, more than any single solver setting, is what turns simulation from a nice picture into engineering evidence.