This guide explains how to model an EV powertrain with clear system boundaries, suitable component fidelity, loss breakdown, regenerative braking limits, and software fit.



This guide explains how to model an EV powertrain with clear system boundaries, suitable component fidelity, loss breakdown, regenerative braking limits, and software fit.

This guide explains what power hardware in the loop testing does, how it differs from controller HIL, and when grid equipment projects need PHIL.

This guide explains how simulation engineers can choose model fidelity, set motor drive parameters, compare machine types, validate results, and judge software transparency for electric motor simulation.

A practical guide to battery management system modelling for lithium ion packs in electric vehicles and grid storage, with attention to plant models, estimators, protection timing, and thermal limits.

A clear comparison of 6 factors that help engineers, educators, and researchers choose power system simulation software for study accuracy, workflow fit, and long-term use.

Buck boost selection starts with the input voltage range, not the converter name.
A lithium-ion cell commonly spans about 3.0 V to 4.2 V during use, which means any pack built from those cells will cross meaningful voltage limits as charge falls. That single fact separates easy converter choices from risky ones. If your source stays fully above or fully below the load target, a simple buck or boost stage will usually fit. If the source crosses the target, a buck boost converter will be the safer model to start with.
That framing matters in simulation because topology errors look acceptable until duty cycle, current ripple, and device stress are checked across the full input range. You are not choosing between three names that do the same job with small differences. You’re choosing the current path that will shape losses, control effort, and usable operating range. Good models make that visible early, before bench work turns a clean schematic into a noisy surprise.
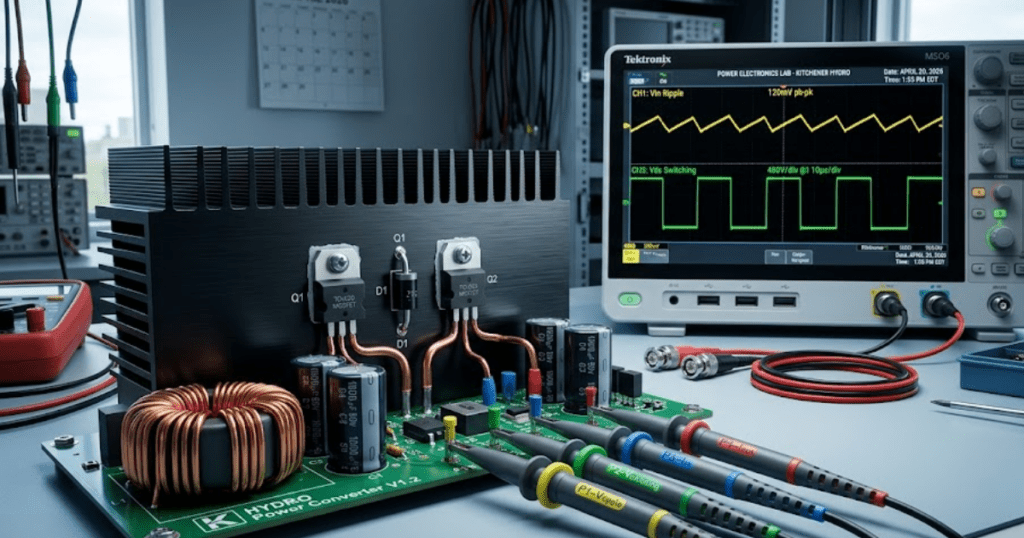
A buck boost converter fits best when your input voltage will move above and below the required output during normal operation. That operating window is the main reason to choose it. It will regulate across the full span where a buck stage or a boost stage alone will lose control at one end.
A battery pack feeding a 48 V bus shows the pattern clearly. Fresh off charge, the pack might sit above 48 V, so a buck stage will work. Near depletion, the same pack can drop below 48 V, so the circuit now needs boost action. A buck boost converter covers both conditions without handing regulation from one stage to another.
This matters because many early models are built around nominal voltage only. That shortcut hides the exact operating points where duty cycle rises, current ripple worsens, and thermal stress starts climbing. If you size the converter around minimum and maximum input first, topology choice becomes much more obvious.
“If you size the converter around minimum and maximum input first, topology choice becomes much more obvious.”
A buck boost converter works by storing energy in an inductor during one switch state and releasing that energy to the output during another. The control loop adjusts how long each state lasts. That timing lets the stage produce an output above or below the input, depending on circuit form and duty cycle.
A simple inverting buck boost shows the sequence well. When the switch closes, current ramps through the inductor and energy builds in its magnetic field. When the switch opens, the inductor forces current through the diode into the output capacitor and load. The average output level follows the duty ratio, so longer on time raises conversion effect.
You will see the same idea in non-inverting forms used in many power systems. The details differ, but the modelling priority stays the same. Watch inductor current, switch current, and capacitor ripple first. Those waveforms tell you more about converter health than the output voltage alone.
A buck converter lowers voltage with a simpler current path than a buck boost converter, which makes it easier to model and usually easier to control. It fits when the minimum input always stays above the target output. Source current is also more continuous, which often reduces input filtering effort.
A 24 V supply feeding a regulated 12 V controller rail is a clean buck case. The switch applies the input to the inductor for part of each cycle, and the inductor averages that pulsed energy into a lower direct current output. Output ripple is set mainly by switching frequency, inductor value, capacitor size, and parasitic resistance.
You will usually pick buck first when the voltage window allows it because fewer stressed conditions need to be checked. Duty cycle stays in a comfortable middle range more often. That usually means easier compensation, lower peak current, and fewer surprises when the model moves from ideal parts to practical ones.
A boost converter raises voltage by charging an inductor from the source and then forcing that stored energy into the load at a higher output potential. It works well when the maximum input always stays below the target output. The tradeoff is that source current and switch stress rise sharply as duty cycle approaches its upper limit.
A 12 V battery feeding a 24 V auxiliary bus is a typical boost case. The inductor charges while the switch is on, and the output capacitor supports the load during that interval. When the switch turns off, the inductor current adds to the source through the diode, which lifts the output above the source voltage.
You should treat high duty cycle results with suspicion, even when the output looks stable. Small errors in switch loss, diode drop, or inductor resistance will distort efficiency quickly. That is why boost models need a close look at current ripple and thermal rise before you accept a neat voltage trace as success.
The best way to simulate a direct current to direct current converter is to start with an ideal switching model, verify waveforms and regulation, and then add non-ideal effects one group at a time. That order keeps faults visible. It also helps you see which parameter actually changes behaviour instead of masking several problems at once.
A useful first pass uses an ideal switch, ideal diode, nominal input sweep, and a resistive load. Once duty cycle and waveforms look correct, you add practical loss terms and compare the shift in average output, ripple, and current peaks. SPS SOFTWARE fits this workflow well because the model structure stays open enough for you to inspect each element instead of treating the converter as a sealed block.
That sequence will save time because each added loss has a visible signature. If output voltage collapses after resistance is added, the topology or magnetics are likely undersized. If only ripple changes, capacitor choice or frequency will need attention before control tuning starts.
Duty cycle limits explain most of the practical difference between buck, boost, and buck-boost choices. When the required duty cycle sits near 0% or 100%, current stress, loss sensitivity, and control margin all worsen. A topology that keeps duty cycle moderate across your operating window will usually produce the cleaner design.
A buck stage is comfortable when input stays well above output, because the required duty ratio stays below unity with margin. A boost stage becomes strained as output rises far above input. A buck boost stage keeps regulation across a wider span, but it pays for that range with more current stress and more parts to tune.
| Use this checkpoint before you commit to a topology. | Read the result as a practical signal from the model. |
|---|---|
| If minimum input stays above target output, a buck stage will usually fit the range. | Duty cycle will stay away from its upper limit, which keeps stress easier to manage. |
| If maximum input stays below target output, a boost stage will usually fit the range. | High load points still need close loss checks because current will climb quickly. |
| If input crosses target output, a buck boost stage will hold regulation across the window. | Current ripple and control effort will rise compared with a single-purpose stage. |
| If the model needs duty cycle near the limits, it is warning you about margin. | Magnetics, switching loss, and transient recovery will become harder to contain. |
A buck boost converter suits electric vehicle power stages when battery voltage will cross the required bus or subsystem voltage over charge state, temperature, and load. That condition appears often in traction support rails, auxiliary buses, and battery interfacing stages. The topology keeps regulation intact when a buck stage or boost stage alone would fall out of range.
An electric vehicle battery does not sit at one fixed number during use, and that is why this topology matters. Global battery electric car sales reached about 14 million in 2023, equal to roughly 18% of all car sales. A wide and growing installed base means more engineers are modelling battery-fed converters across full operating windows rather than around nominal pack values.
A practical case is a high-voltage pack feeding a lower auxiliary rail during one mode and accepting power from a lower source during another. The exact control scheme will vary, but your model should always sweep minimum pack voltage, maximum pack voltage, and step load conditions. That is where converter choice stops being academic and starts showing its fit.
“Good converter selection comes from that discipline, because the right stage is the one that keeps its behaviour when the ideal parts are gone.”
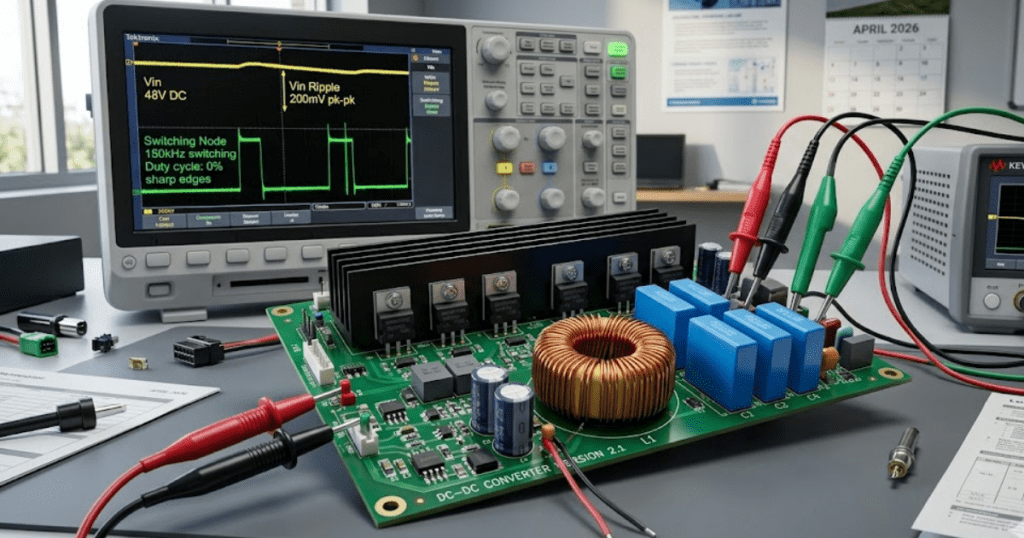
Parasitics decide whether a converter that looks strong in simulation will still behave once copper resistance, capacitor loss, layout inductance, and device timing enter the picture. These effects are not small corrections. They will reshape ripple, peak current, voltage overshoot, and efficiency enough to overturn an early topology choice.
A bench build often exposes this gap at the switching node. The ideal model shows clean transitions, while the hardware shows ringing, extra heating, and output ripple that seemed absent before. That usually traces back to ignored equivalent series resistance, loop inductance, or recovery behaviour. Once those terms are present, the best topology is the one that still meets the target with margin rather than the one that looked best on a clean schematic.
That is the useful habit to keep after the first successful run. SPS SOFTWARE works best when you treat every component as inspectable and editable, then tighten the model until it explains the waveform you expect to measure. Good converter selection comes from that discipline, because the right stage is the one that keeps its behaviour when the ideal parts are gone.

Voltage stability analysis in simulation works when you treat reactive power margin as the main signal, not voltage magnitude alone.
Voltage collapse rarely starts as a single low-voltage reading. It starts when generators, capacitor banks, static compensators, or inverter controls run out of reactive support while transfer stress keeps rising. Wind and solar produced 13.4% of global electricity in 2023, which means more grids now depend on converter behaviour that must be represented properly in stability studies. Good voltage stability analysis will show you where the weak buses are, which limits bind first, and how protection will react when voltage recovery slows.
Useful simulation comes from disciplined model choices, not from a single study type. You’re trying to answer a practical engineering question about margin, collapse risk, or corrective action. That means your model will need credible load behaviour, realistic control limits, and a study method matched to the disturbance or loading pattern you care about. If those pieces are wrong, the plots will look clean and still tell you the wrong story.
“The key measure is reactive power margin.”

Voltage stability is the ability of a power system to maintain acceptable voltage after load growth, switching, or a disturbance. The key measure is reactive power margin. A bus can sit near nominal voltage and still be close to collapse. That is why voltage magnitude alone won’t tell you enough.
Consider a transmission corridor feeding a heavy urban load pocket on a hot evening. Tap changers keep distribution voltage near target, induction motors draw more reactive current, and a nearby generator reaches its reactive limit. The voltage profile can still look acceptable for a short period, yet the system has almost no extra support left. A small line outage or another step in loading will push the bus toward the nose of the power-voltage curve.
This matters because voltage instability is usually a limit problem before it becomes a visible low-voltage problem. You need to track generator reactive ceilings, switched compensation steps, transformer tap action, and load sensitivity to voltage. If you don’t, you’ll confuse a healthy operating point with a fragile one. Good analysis starts with the question, “How much support is left before controls saturate?”
A credible network model includes the parameters and controls that actually shape voltage response under stress. You need correct line data, transformer taps, shunt devices, generator limits, load composition, and control logic. If any of those are simplified too far, the margin you calculate won’t match field behaviour.
A practical setup begins with a solved base case and a clear study boundary. A feeder study needs feeder regulators, capacitor switching logic, and motor-rich loads. A bulk system study needs generator excitation, reactive capability limits, and transfer paths that reflect the operating condition you’re testing. In SPS SOFTWARE, that execution step is useful because you can inspect and edit model equations and protection settings instead of accepting a closed result.
The fastest way to lose confidence in voltage stability analysis is to skip basic model checks. Use this minimum checklist before you start stressing the system.
PV curve analysis is the quickest way to find where voltage stability margin is thin. You increase loading or transfer stress step by step and watch how bus voltage responds. The weak buses are the ones that approach the nose first. Those buses deserve your attention before deeper studies begin.
A common workflow stresses a transfer corridor from a generation area into a load area while monitoring several buses. One bus will usually show a sharper voltage drop and a smaller loadability margin than the others. That bus becomes the anchor point for corrective action screening. You can then test shunt support, generator redispatch, or tap adjustments and see which measure shifts the nose to a safer operating point.
PV curves are valuable because they turn a vague concern about collapse into a ranked map of weak locations. They also keep you from spreading effort across the whole network when the limiting problem is local. You’ll get the most value when each step respects equipment limits and control actions. If reactive ceilings are ignored, the curve will look better than the system really is.
QV studies answer a narrower but very important question. They show how much reactive injection a bus needs to maintain a chosen voltage level. That makes them useful when the main issue is local support deficiency. They are less about loadability and more about reactive deficiency at a specific location.
A weak substation bus near a large motor load is a good case. The PV curve can confirm that the area has poor margin, but the QV curve will show how much reactive support is required to hold 1.0 per unit or another target. That makes capacitor sizing, static compensation studies, and support placement more concrete. You’re no longer guessing which bus needs help or how much help it needs.
QV results become especially important after generator reactive limits are reached or after a line outage changes local VAR supply. They also expose cases where a bus needs support that a distant source can’t deliver effectively because of transmission reactance. If your question is “Where do I place support and how much is required?” a QV study will answer it more directly than a PV curve.
Dynamic simulation shows how the system moves from a disturbance toward recovery or collapse over time. It captures control action, delay, saturation, and protection logic that static studies cannot represent fully. That is why it is essential after PV and QV studies identify weak areas. Static margin tells you the distance to trouble, while dynamic response shows the route.
A bus fault cleared after several cycles can leave motors stalled, transformer taps moving, and reactive devices switching in sequence. A static study will miss that timing. An RMS model can show slow voltage recovery after fault clearing, and a more detailed electromagnetic model can show converter current limiting or control interaction during the same event. Those details matter when the operating point is already close to its reactive ceiling.
Use this checkpoint to match the study method to the question you’re asking.
| Study approach | What it tells you clearly | When it is the best fit |
| Base case power flow review | It confirms that voltages, flows, and reactive outputs match the operating condition you intend to study. | Use it before any stability test so every later result starts from a credible state. |
| Power-voltage curve analysis | It ranks weak buses by showing where voltage collapses first as loading or transfer stress rises. | Use it when you need a quick view of margin and bus weakness across the network. |
| Reactive-voltage curve analysis | It shows how much local reactive support is required to hold a chosen voltage at a bus. | Use it when placement and sizing of var support are the main questions. |
| RMS disturbance simulation | It captures slower control action such as excitation, tap changes, motor recovery, and protection timing. | Use it after a fault, outage, or switching event when time response will shape the outcome. |
| Electromagnetic transient simulation | It resolves converter limits and short-term control interaction that are too detailed for steady-state methods. | Use it for inverter-rich areas or when switching and control detail will alter voltage recovery. |
| Protection coordination review | It shows which elements will trip first and how those trips alter the stability margin you thought you had. | Use it before final judgement so the simulated margin reflects the actual protection scheme. |
Distribution voltage stability studies will fail if load models are too simple. Feeders are shaped by motors, thermostatic loads, rooftop generation, regulator action, and unbalance. Constant power assumptions can overstate or understate collapse risk. You need behaviour that matches the actual feeder mix.
A long feeder serving air conditioning, small commercial motors, and distributed generation will respond very differently from a feeder made mostly of resistive heating. After a fault or voltage dip, motor stalling can hold reactive consumption high while regulators and capacitor controls respond with delay. If your model treats all of that as a static constant power block, the predicted recovery will look smoother than the feeder will actually deliver.
Distribution studies also need attention to where controls act and how quickly they act. Tap changers can support customer voltage while pushing the upstream system closer to its limit. Capacitor banks can help one section and worsen another if switching logic is poorly timed. You can’t study voltage collapse risk on a feeder as if it were a reduced bulk bus. The feeder’s composition is the study.
Renewable-heavy grids need explicit inverter current limits, control priorities, and reactive support settings in the model. Converter-based resources do not respond like synchronous machines. When voltage drops, their controls will follow current limits and protection thresholds. If those limits are missing, the simulated margin will be overstated.
A solar plant tied to a weak grid offers a clear case. During a voltage dip, the inverter controller will often prioritise reactive current support up to a current ceiling. Past that ceiling, active power support falls and further voltage support is capped. Solar photovoltaic generation rose by almost 320 TWh in 2023, the largest annual increase ever recorded, which makes this modelling detail important for modern stability studies.
You’ll also need to represent plant-level voltage control, collector system impedance, and grid code settings that govern fault ride-through. A generic source behind a reactance won’t capture those limits. That shortcut might be acceptable for rough screening, but it won’t support a credible judgment about collapse risk. If your network is rich in inverter-based resources, the voltage stability model has to reflect converter physics and control logic.
“A margin that exists only before a relay trip is not usable margin.”

Power system protection coordination is part of voltage stability analysis because protection will define the final outcome once voltage recovery slows or current rises. A margin that exists only before a relay trip is not usable margin. You need the study to reflect the same trip logic the field equipment will enforce.
A delayed undervoltage trip on a wind plant, a load-shedding stage on a weak feeder, or an overexcitation limiter on a generator can each alter the path from disturbance to collapse. One setting can preserve service long enough for voltage recovery, while another can remove support and deepen the dip. That is why protection review belongs inside the simulation workflow instead of after it. If the relay clears first, your PV or QV result won’t be the whole answer.
The best engineering judgment comes from lining up margins, control limits, and protection timing in one consistent model. SPS SOFTWARE fits naturally in that workflow because open models make it easier to inspect the assumptions behind network response and relay action. You’re not looking for a dramatic plot. You’re looking for a study result that still makes sense when the system is stressed, the controls saturate, and the protection acts exactly as set.

Accurate power electronics simulation starts with model purpose.
Most converter errors come from poor setup choices, not from missing complexity. If you define the study target first, you’ll pick the right model detail, the right time resolution, and the right checks for waveform accuracy, losses, and stability.
“These seven practices address the setup errors that most often distort converter results.”
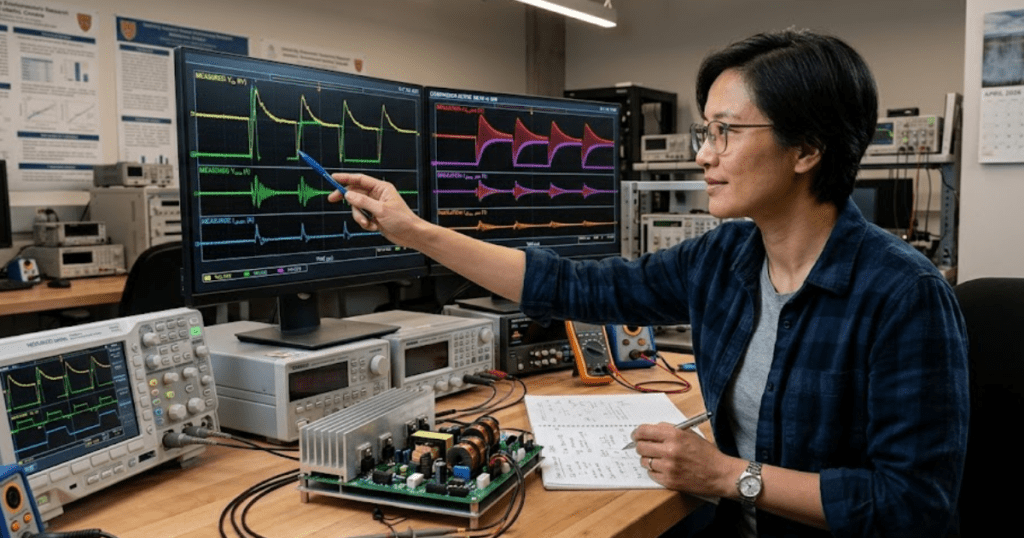
Power electronics simulation becomes trustworthy when the model answers one clear engineering question. That question sets the needed fidelity. It also sets the acceptable run time. You’re far less likely to tune a model around the wrong waveform when the target is explicit.
A ripple estimate for a buck stage needs different detail than a thermal check for an inverter leg. One study cares about switching edges and passive values. The other cares about loss terms and longer operating windows. Keep these scope markers visible before you touch the solver.
These seven practices address the setup errors that most often distort converter results. Each one removes a specific source of mismatch between the model and the circuit. Use them in order when you can. That sequence keeps your simulation of power electronics grounded in measurable behaviour.
Device model choice should follow switching speed, voltage stress, thermal range, and the output you need to trust. A simple switch with fixed on resistance works for control tuning in a low-frequency chopper. That same model will miss reverse recovery and output capacitance effects in a hard-switched silicon carbide bridge. You’ll also get the wrong current spike and the wrong loss split during commutation. If your study focuses on average duty response, compact models are enough. If you need turn on loss, diode snap, or dv/dt stress, the device model must include those mechanisms. Model detail should rise only when the study target needs it, or run time will climb without better accuracy.
Parasitics shape switching waveforms far more than many first-pass models admit. A half bridge with ideal interconnects can look stable and clean, then ring badly on the bench because loop inductance was ignored. A few nanohenries in the commutation path will alter overshoot, current slew, and diode stress. ESR and ESL in the DC link capacitor will also reshape the voltage seen by the devices during edge transitions. You can’t guess these values from textbook schematics and expect good agreement. Pull them from layout estimates, manufacturer data, or measured impedance where possible. Once parasitics are realistic, the simulation stops hiding the resonances that your hardware will actually show.
Time step selection controls whether the solver sees the physics you’re trying to study. A step that skips across turn-on or turn-off intervals will smooth sharp transitions and understate peak stress. A 100 kHz converter with 50 ns edge activity needs much finer resolution than the switching period alone suggests. The same model can look perfectly stable at one step size and clearly unstable at another. Fixed step runs are useful for repeatability, but the step must still capture dead time, diode recovery, and narrow pulses. Variable step runs can help, yet loose tolerances will still bury fast events. If waveforms stop changing when you tighten the step, you’re close to a defendable setting.
Waveforms are only meaningful when the converter has settled into the operating point you want to examine. Starting a loss study from zero current and zero capacitor voltage will contaminate the first cycles with startup behaviour. That makes current ripple, switch stress, and average power look worse or better than they really are. A boost converter near 70% duty can need many cycles before the inductor current and output voltage stop drifting. It’s worth running an initial settling window, then collecting data after the transient dies out. You’ll save time during analysis because the measured interval actually represents the target mode. It’s also easier to compare against bench captures taken after the hardware has stabilised.
Gate signals are part of the power stage model because timing errors directly alter conduction paths. Ideal complementary pulses with zero delay can hide shoot-through risk or erase body diode conduction that will appear in hardware. A synchronous buck stage shows this clearly when a few tens of nanoseconds of dead time shift current from the channel into the diode. That shift affects efficiency, reverse recovery, and device temperature. Don’t stop at nominal dead time either. Add propagation delay mismatch, rise and fall differences, and gate resistance effects when those terms matter to the study. If your timing model is too clean, the electrical results will be too clean as well.
Loss estimates become more believable when they agree with a simple energy balance. The average input power should line up with output power plus stored energy change plus losses over the sampled interval. If those terms don’t reconcile, the issue is often a sign error, an averaging window that is too short, or missing conduction and switching terms. A phase-shifted full bridge can show plausible switch loss values while total power still fails to balance because magnetics or snubber losses were omitted. Use cycle-based checks before trusting thermal results. It’s a fast way to catch hidden mistakes. Once the power balance closes, every later temperature or efficiency calculation rests on firmer ground.
“Once the power balance closes, every later temperature or efficiency calculation rests on firmer ground.”
Validation means comparing the model against something outside the model itself. Bench measurements are strongest, but analytical checks, manufacturer curves, and peer-reviewed reference cases also help. A diode current waveform that matches your expectation in shape but misses the reverse recovery peak still fails validation. The same goes for efficiency results that look smooth yet miss measured conduction loss at light load. Open model inspection matters here because you need to trace what each equation is doing. SPS SOFTWARE fits this step well because the component models are transparent enough for you to inspect parameters, equations, and assumptions instead of treating the block as a sealed box.
| What to focus on | What the practice protects |
|---|---|
| 1. Match device models to the converter operating regime | The chosen device model must include only the switching effects that matter to the study target. |
| 2. Set parasitic values from measured layout data | Measured or estimated interconnect and passive parasitics keep ringing and overshoot from being hidden. |
| 3. Choose solver steps that resolve every switching event | Time resolution must be fine enough to capture narrow pulses and commutation details. |
| 4. Start from steady state before capturing waveforms | Only settled operating intervals should feed ripple, stress, efficiency, and loss checks. |
| 5. Model gate drive timing with realistic dead time | Timing details decide which device conducts and how much switching stress appears. |
| 6. Check losses with energy balance across each cycle | Power balance reveals missing terms and bad averaging before thermal results are trusted. |
| 7. Validate waveforms against independent reference results | Independent checks stop a tidy model from passing when its physics still disagree with measured behaviour. |

Start each converter study with one operating point, one pass or fail metric, and one validation target. That simple structure keeps the model scoped correctly. It also tells you what detail to keep. You’ll get useful results faster because each setup choice serves a defined purpose.
A classroom buck converter, a lab scale inverter, and a research prototype will all use the same discipline even when their complexity differs. Set the study goal, add only the physics that influence that goal, then verify solver settings, timing, parasitics, and power balance before you trust the plots. SPS SOFTWARE supports this kind of work well because transparent models make each assumption easier to inspect, question, and refine.

A credible three-phase inverter simulation starts with the study objective, not the switching block.
Renewable capacity additions reached almost 560 GW in 2023, and solar PV supplied about 75% of that total. That scale puts more three-phase inverters onto feeders, plant buses, and campus grids, so model quality now affects routine engineering work rather than niche studies. You will get better answers faster when model fidelity follows the grid question you need to resolve.
You are not choosing between a simple model and a detailed model in the abstract. You are choosing the minimum detail that still preserves the behaviour that matters at the point of common coupling, inside the control loops, and across the dc link. That stance keeps inverter simulation useful, readable, and easier to validate before you commit to hardware or protection settings.
“A three-phase inverter model is useful only when its detail matches the question you need answered.”
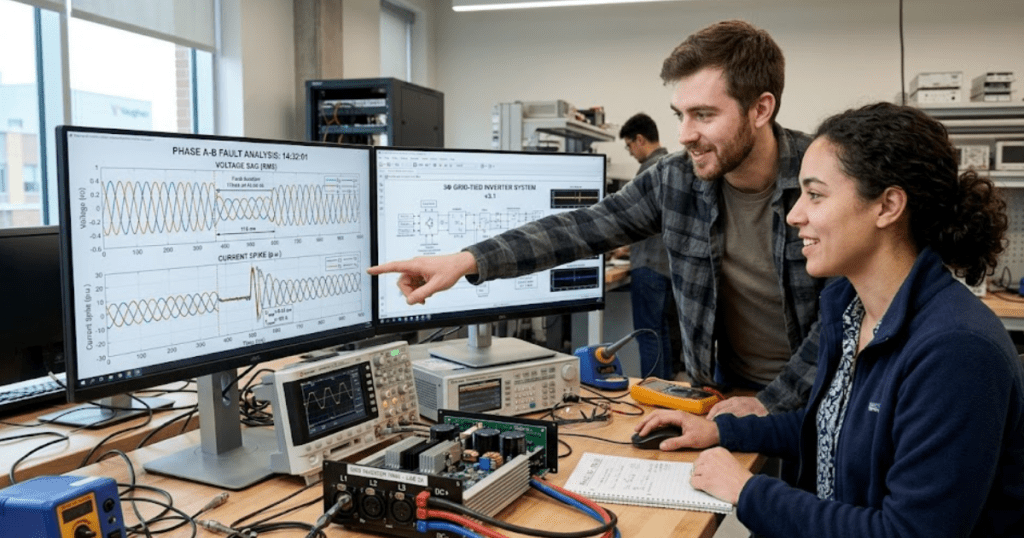
A three-phase inverter model is useful only when its detail matches the question you need answered. Grid current control, filter tuning, fault response, and feeder studies do not need the same inverter simulation, and the wrong level of detail will either waste runtime or hide the failure you need to see.
A 500 kW solar inverter tied to a short industrial feeder gives a clear example. If you need to verify current ripple, semiconductor gating logic, or desaturation of the current loop, a switching model is the right tool. If you need to see feeder voltage response during a 10 s irradiance drop, an average model will answer faster and with less numerical burden.
You will get more value from your inverter simulator once you write the study question as a measurable output. That usually means naming the waveform, event, and time window before you place any block. A model built that way stays focused, and it is much easier to validate when results start to look suspicious.
Switching models are the right choice when the study depends on instantaneous phase voltage, PWM ripple, dead time, sampling effects, or semiconductor commutation timing. They preserve the behaviour that average models smooth out, so they are the safest option for validating current controllers, protection logic, and filter resonance near the switching band.
A 50 kW inverter with a 10 kHz carrier and an LCL filter shows why this matters. Once you inject one grid voltage sag and inspect phase current at the point of common coupling, you can see ripple growth, saturation of the current regulator, and asymmetry from dead time. Those effects shape harmonic content and controller stress, yet they disappear if the bridge is replaced with a controlled voltage source.
You pay for that fidelity with smaller time steps and longer runs. That cost is worth it when you are testing logic transitions, overcurrent handling, or the link between modulation index and phase current. It is not worth it for a 30 s feeder disturbance where switching ripple contributes very little to the engineering answer you need.
Average models are the right choice when you need correct power exchange, current loop response, dc-link energy balance, and grid interaction over longer windows. They remove switching detail and keep the dynamics that matter for system studies, which makes them far more practical for long disturbances, parameter sweeps, and feeder-level work.
Utility planning needs that efficiency because study scope keeps growing. Solar and battery storage were expected to account for 81% of new U.S. utility-scale generating capacity added in 2024. A feeder with several inverter-based resources can’t be studied effectively if every bridge is resolved at the carrier level for every scenario.
An average model is still only good when its control paths stay honest. You still need the current controller, phase-locked loop, dc-link dynamics, and current limits. If you collapse those into an ideal power source, the model becomes easy to run but hard to trust. That is where many grid studies drift away from physical behaviour, even though the waveforms look clean.
| Study question | Model choice that usually fits | What must stay explicit |
| You need phase current ripple and harmonic content at the point of common coupling. | A switching model will preserve carrier effects and timing detail. | The bridge, PWM method, dead time, and LCL filter should remain explicit. |
| You need current loop tuning during grid voltage sags or step commands. | A switching model will show how sampling and saturation alter the response. | Controller delays, limits, and measurement filtering should remain explicit. |
| You need feeder voltage and power flow over several seconds. | An average model will run faster while preserving useful inverter dynamics. | The current controller, phase-locked loop, and dc-link energy balance should remain explicit. |
| You need many parameter sweeps across line impedance or plant dispatch points. | An average model will support broader scenario coverage within practical runtime. | Grid impedance, current limits, and plant setpoints should remain explicit. |
| You need to validate protection trips caused by modulation or gating behaviour. | A switching model will expose events hidden by averaged voltage sources. | Bridge states, thresholds, and fault logic should remain explicit. |
LCL filter values determine how much switching ripple reaches the grid and where resonance appears, so they directly shape current quality at the point of common coupling. A credible model must include inverter-side inductance, grid-side inductance, filter capacitance, and damping, because each term changes the closed-loop response.
A 400 V converter tied to a 50 Hz bus makes the tradeoff obvious. If the filter capacitor is oversized, reactive current rises and the controller works harder near nominal operation. If grid-side inductance is too small, switching ripple leaks into the feeder. If damping is ignored, a neat sinusoid in simulation can turn into oscillatory current once the controller excites the resonant mode.
You should place the resonance high enough to separate it from the control bandwidth and low enough to avoid poor attenuation near the carrier. That balance matters more than any single textbook ratio. Good inverter simulation keeps filter losses and damping visible, because current quality problems are often filter problems wearing a control-system disguise.
Grid impedance sets the inverter’s effective operating condition, so a model with an ideal stiff source will overstate stability margin on weak feeders. Accurate studies need the source Thevenin equivalent, feeder impedance, transformer leakage, and local capacitance, because each part shifts resonance, controller gain, and phase margin.
A campus microgrid and a rural feeder will not stress the same inverter in the same way. The campus case might look stiff enough that a wide current-loop bandwidth seems harmless. The rural feeder can add enough inductive impedance that the same tuning produces oscillation near the phase-locked loop bandwidth. A simple impedance sweep often reveals the problem faster than another round of controller retuning.
SPS SOFTWARE fits this step well because you can inspect source, line, transformer, and control assumptions directly instead of accepting a sealed-inverter simulator. That transparency matters when results shift after one feeder parameter changes. You’re then checking physics and implementation at the same time, which is exactly where many grid-tied models fail quietly.
Control bandwidth must be set with sampling, computation, and PWM update delays included, because digital timing removes phase margin that continuous-time tuning will hide. A model that ignores those delays will look stable on paper and then ring, overshoot, or saturate once discrete control is placed in the loop.
A common mistake appears in a current controller tuned near one-tenth of the switching frequency. The gain margin can still look comfortable until you add one sample of current measurement delay and one sample of modulation delay. That same tuning then produces noisy current, poor disturbance rejection, and a phase-locked loop that interacts badly during voltage dips.
You should model the controller exactly as it will execute, with sampling order, zero-order hold, filtering, and limit handling all included. That does not make the model harder to understand. It makes the result honest. Once those delays are visible, you’ll usually lower the target bandwidth a little and gain far better behaviour across weak-grid conditions.
Solar input models must capture the DC-link behaviour because the inverter does not see irradiance directly. It sees source impedance, power limits, control action from maximum power point tracking, and capacitor energy. A fixed DC source can support rough control checks, but it will miss voltage sag, current limiting, and recovery behaviour during solar transients.
A grid-tied PV system during a fast cloud edge is a good test case. Panel power drops, the dc-link capacitor supplies the deficit for a short interval, and the inverter controller adjusts modulation to keep ac current within limits. If your model uses an ideal stiff dc source, none of that energy exchange appears, so the current controller looks calmer than it really is.
You do not need a full cell-level solar model for every study. You do need enough source dynamics to preserve dc-link excursions during the events you care about. That usually means a controlled dc source with realistic source resistance, power limits, capacitor value, and tracking dynamics. Once those are present, grid integration studies stop masking power-balance errors.
“Disturbance tests are the fastest way to prove that a three-phase inverter model is trustworthy.”
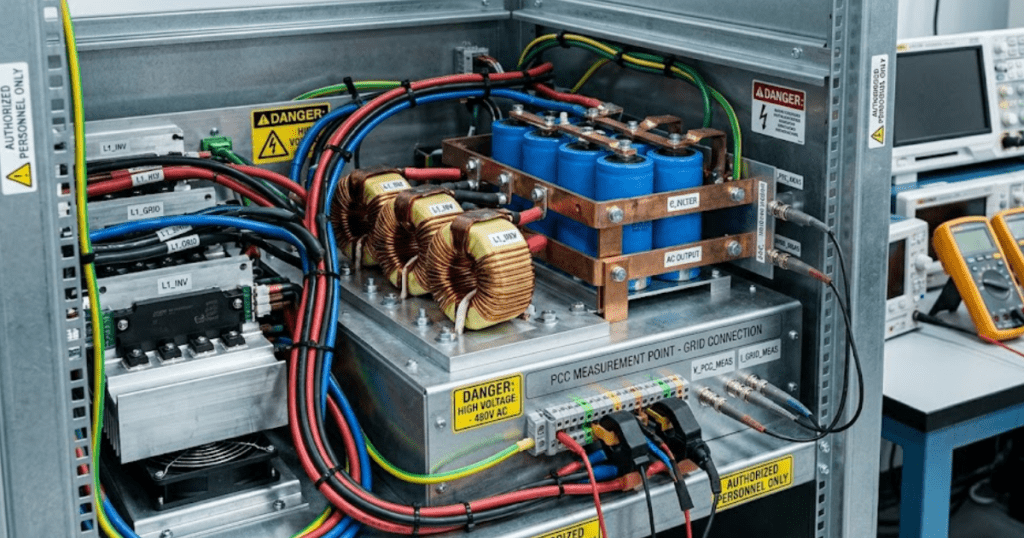
Disturbance tests are the fastest way to prove that a three-phase inverter model is trustworthy. One model that survives step changes, voltage sags, phase jumps, current limits, and impedance variation will tell you far more than a dozen steady-state plots, because weak assumptions usually fail when the system is forced away from nominal operation.
A disciplined test set might start with a current reference step, then move to a 20% voltage sag, then repeat the same event with higher feeder impedance and a lower dc-link voltage. Those cases expose hidden couplings between the phase-locked loop, current regulator, and filter. When a model passes only under ideal grid strength, you are looking at a model that is still unfinished.
SPS SOFTWARE is most useful here when every block stays open to inspection, because good engineering judgment depends on assumptions you can trace and revise. Over time, the strongest grid-connected models are not the ones with the most detail. They are the ones tested against the right disturbances until their limits are clear and their behaviour stays consistent.